

Roles of the hexosamine biosynthetic pathway and pentose phosphate pathway in bile acid-induced cancer development
- PMID: 31215094
- PMCID: PMC6676276
- DOI: 10.1111/cas.14105
Roles of the hexosamine biosynthetic pathway and pentose phosphate pathway in bile acid-induced cancer development
Abstract
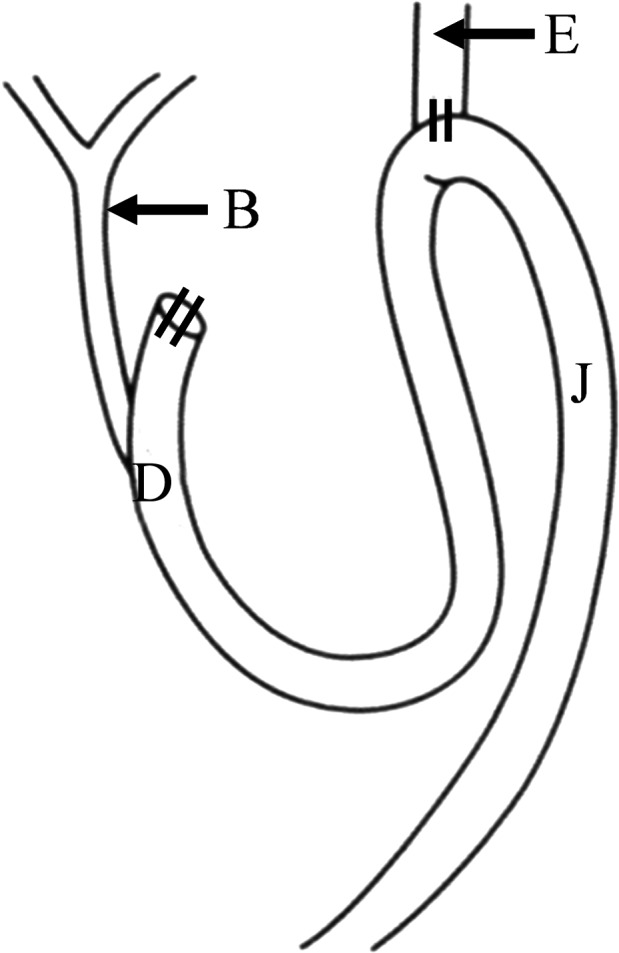
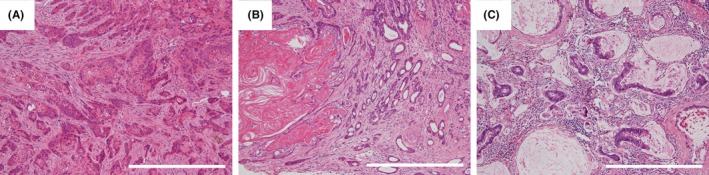
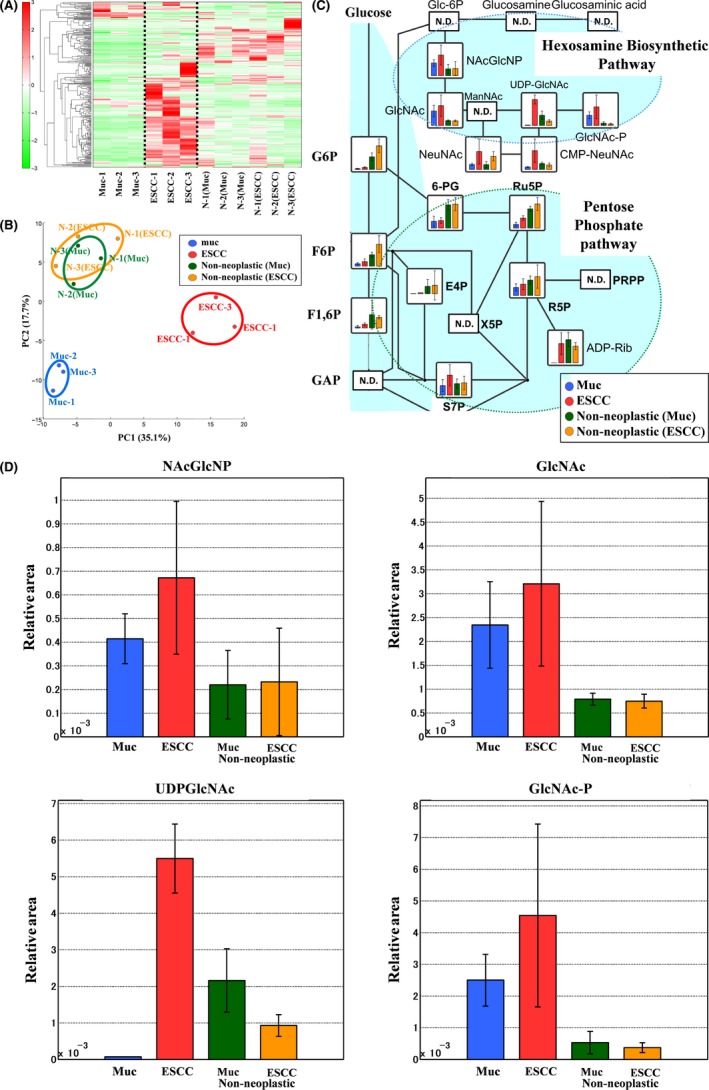
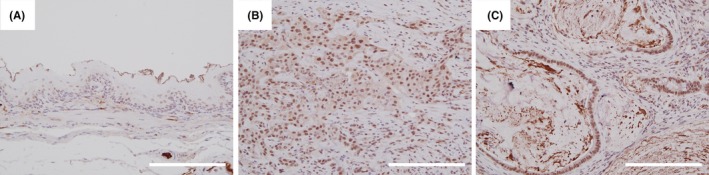
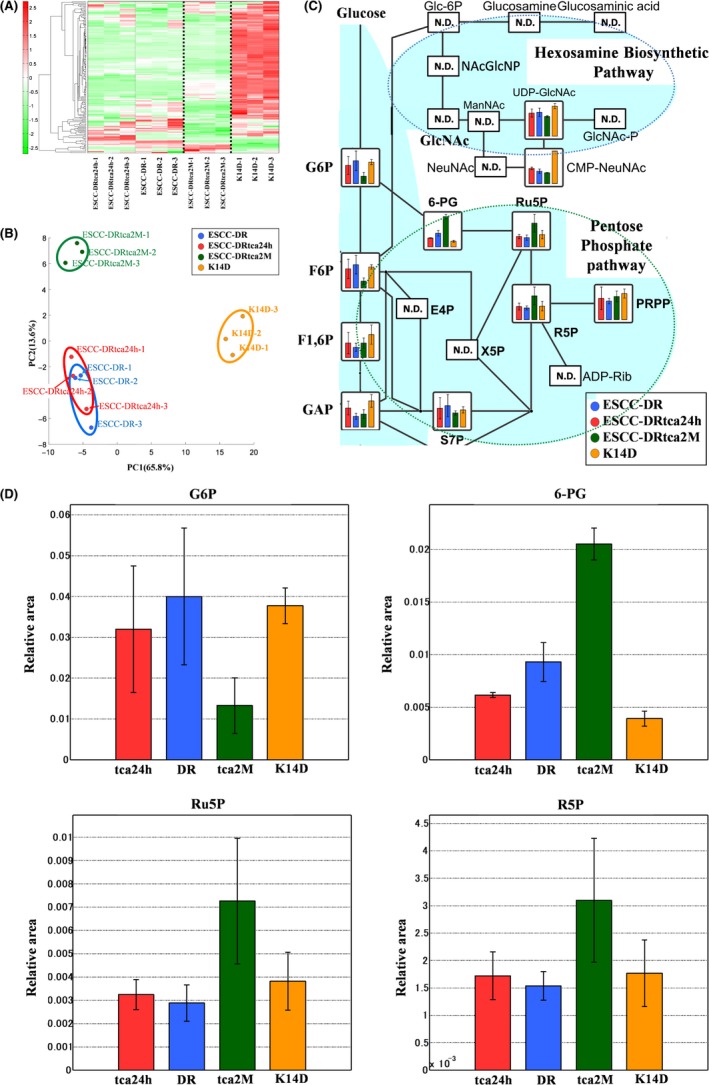
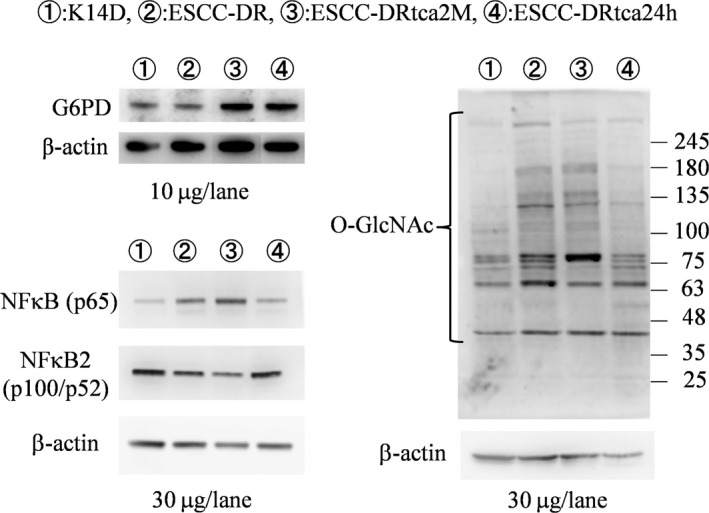
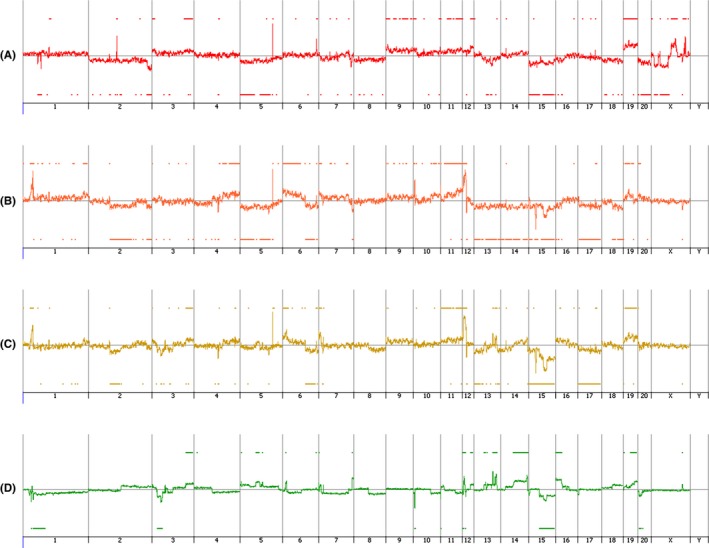
Esophageal squamous cell carcinomas (ESCCs) as well as adenocarcinomas (EACs) were developed in rat duodenal contents reflux models (reflux model). The present study aimed to shed light on the mechanism by which bile acid stimulation causes cancer onset and progression. Metabolomics analyses were performed on samples of neoplastic and nonneoplastic tissues from reflux models, and K14D, cultivated from a nonmetastatic, primary ESCC, and ESCC-DR, established from a metastatic thoracic lesion. ESCC-DRtca2M was prepared by treating ESCC-DR cells with taurocholic acid (TCA) to accelerate cancer progression. The lines were subjected to comprehensive genomic analyses. In addition, protein expression levels of glucose-6-phosphate dehydrogenase (G6PD), nuclear factor kappa B (NF-κB) (p65) and O-linked N-Acetylglucosamine (O-GlcNAc) were compared among lines. Cancers developed in the reflux models exhibited greater hexosamine biosynthesis pathway (HBP) activation compared with the nonneoplastic tissues. Expression of O-GlcNAc transferase (OGT) increased considerably in both ESCC and EAC compared with nonneoplastic squamous epithelium. Conversely, cell line-based experiments revealed the greater activation of the pentose phosphate pathway (PPP) at higher degrees of malignancy. G6PD overexpression in response to TCA exposure was observed. Both NF-κB (p65) and O-GlcNAc were expressed more highly in ESCC-DRtca2M than in the other cell lines. Moreover, ESCC-DRtca2M cells had additional chromosomal abnormalities in excess of ESCC-DR cells. Overall, glucose metabolism was upregulated in both esophageal cancer tissue and cell lines. While bile acids are not mutagenic, chronic exposure seems to trigger NF-κB(p65) activation, potentially inducing genetic mutations as well as facilitating carcinogenesis and cancer progression. Glucose metabolism was upregulated in both esophageal cancer tissue and cell lines, and the HBP was activated in the former. The cell line-based experiments demonstrated upregulation of the pentose phosphate pathway (PPP) at higher degrees of malignancy. While bile acids are not mutagenic, chronic exposure seems to trigger G6PD overexpression and NF-κB (p65) activation, potentially inducing genetic mutations as well as facilitating carcinogenesis and cancer progression.
Keywords: NF-κB; bile acids; hexosamine biosynthesis pathway; metabolomics analyses; pentose phosphate pathway.
© 2019 The Authors. Cancer Science published by John Wiley & Sons Australia, Ltd on behalf of Japanese Cancer Association.
Figures
Similar articles
-
HMGA1 promotes the progression of esophageal squamous cell carcinoma by elevating TKT-mediated upregulation of pentose phosphate pathway.Cell Death Dis. 2024 Jul 30;15(7):541. doi: 10.1038/s41419-024-06933-x. Cell Death Dis. 2024. PMID: 39080260 Free PMC article.
-
Targeting the hexosamine biosynthetic pathway and O-linked N-acetylglucosamine cycling for therapeutic and imaging capabilities in diffuse large B-cell lymphoma.Oncotarget. 2016 Dec 6;7(49):80599-80611. doi: 10.18632/oncotarget.12413. Oncotarget. 2016. PMID: 27716624 Free PMC article.
-
Epigenetically upregulated oncoprotein PLCE1 drives esophageal carcinoma angiogenesis and proliferation via activating the PI-PLCε-NF-κB signaling pathway and VEGF-C/ Bcl-2 expression.Mol Cancer. 2019 Jan 4;18(1):1. doi: 10.1186/s12943-018-0930-x. Mol Cancer. 2019. PMID: 30609930 Free PMC article.
-
NOTCH and Esophageal Squamous Cell Carcinoma.Adv Exp Med Biol. 2021;1287:59-68. doi: 10.1007/978-3-030-55031-8_5. Adv Exp Med Biol. 2021. PMID: 33034026 Free PMC article. Review.
-
Targeted therapy of esophageal squamous cell carcinoma: the NRF2 signaling pathway as target.Ann N Y Acad Sci. 2018 Dec;1434(1):164-172. doi: 10.1111/nyas.13681. Epub 2018 May 11. Ann N Y Acad Sci. 2018. PMID: 29752726 Free PMC article. Review.
Cited by
-
Elevated pentose phosphate pathway flux supports appendage regeneration.Cell Rep. 2022 Oct 25;41(4):111552. doi: 10.1016/j.celrep.2022.111552. Cell Rep. 2022. PMID: 36288713 Free PMC article.
-
Discovering Biomarkers in Peritoneal Metastasis of Gastric Cancer by Metabolomics.Onco Targets Ther. 2020 Jul 27;13:7199-7211. doi: 10.2147/OTT.S245663. eCollection 2020. Onco Targets Ther. 2020. PMID: 32801750 Free PMC article.
-
Glucose metabolism in B cell malignancies: a focus on glycolysis branching pathways.Mol Oncol. 2024 Jul;18(7):1777-1794. doi: 10.1002/1878-0261.13570. Epub 2024 Jan 3. Mol Oncol. 2024. PMID: 38115544 Free PMC article. Review.
-
Human Microbiota in Esophageal Adenocarcinoma: Pathogenesis, Diagnosis, Prognosis and Therapeutic Implications.Front Microbiol. 2022 Jan 14;12:791274. doi: 10.3389/fmicb.2021.791274. eCollection 2021. Front Microbiol. 2022. PMID: 35126331 Free PMC article. Review.
-
Starvation-induced HBP metabolic reprogramming and STAM2 O-GlcNAcylation facilitate bladder cancer metastasis.Sci Rep. 2025 Mar 12;15(1):8480. doi: 10.1038/s41598-025-92579-4. Sci Rep. 2025. PMID: 40075080 Free PMC article.
References
-
- Jenkins GJ, Harries K, Doak SH, et al. The bile acid deoxycholic acid (DCA) at neutral pH activates NF‐kappaB and induces IL‐8 expression in oesophageal cells in vitro. Carcinogenesis. 2004;25:317‐323. - PubMed
-
- Jankowski JA, Harrison RF, Perry I, et al. Barrett's metaplasia. Lancet. 2000;356:2079‐2085. - PubMed
-
- Fein M, Fuchs KH, Stopper H, et al. Duodenogastric reflux and foregut carcinogenesis: analysis of duodenal juice in a rodent model of cancer. Carcinogenesis. 2000;21:2079‐2084. - PubMed
-
- Domellöf L, Reddy BS, Weisburger JH. Microflora and deconjugation of bile acids in alkaline reflux after partial gastrectomy. Am J Surg. 1980;140:291‐295. - PubMed
-
- Graffner H, Florén CH, Nilsson A. Conjugated bile salts in gastric aspirates after gastric resection. Scand J Gastroenterol. 1984;19:116‐118. - PubMed
MeSH terms
Substances
Grants and funding
LinkOut - more resources
Full Text Sources
Medical
Research Materials
Miscellaneous
