. 2019 Aug;110(8):2520-2528.
doi: 10.1111/cas.14100. Epub 2019 Jul 7.

Stromal iodothyronine deiodinase 2 (DIO2) promotes the growth of intestinal tumors in ApcΔ716 mutant mice

Affiliations

Stromal iodothyronine deiodinase 2 (DIO2) promotes the growth of intestinal tumors in ApcΔ716 mutant mice

Yasushi Kojima et al. Cancer Sci. 2019 Aug.

Abstract

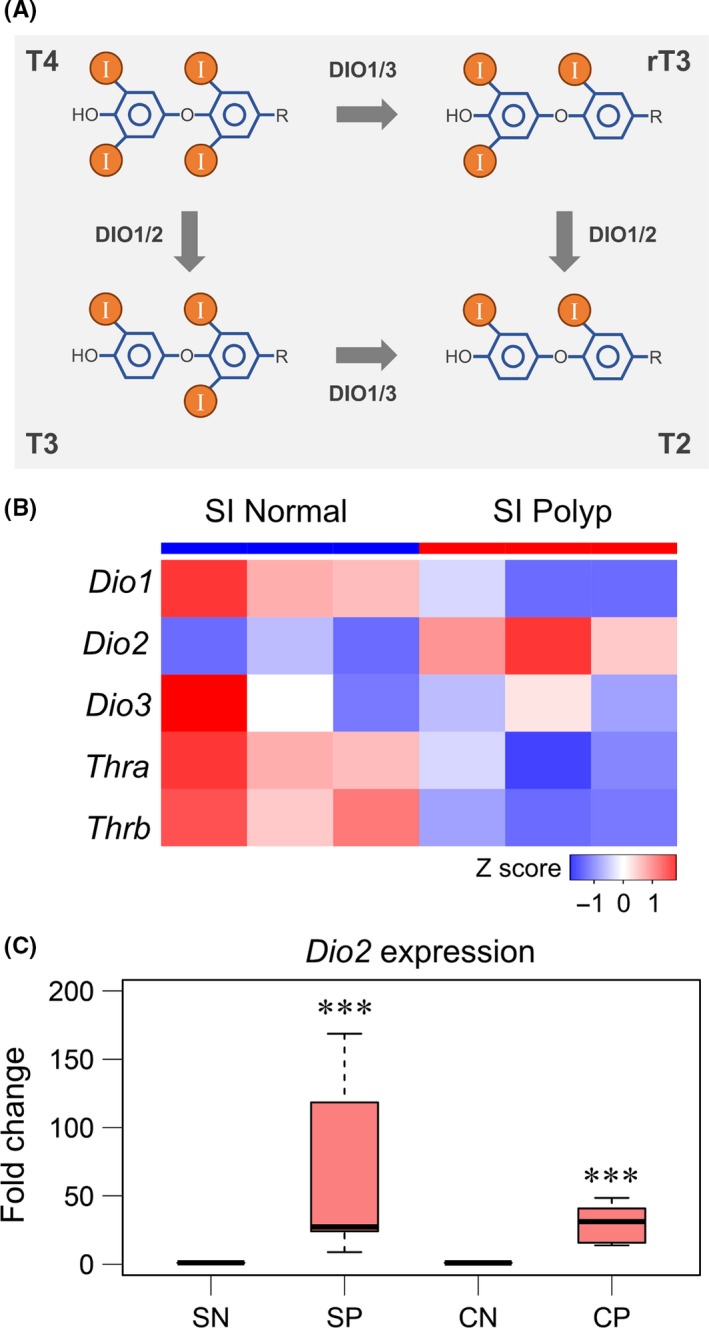
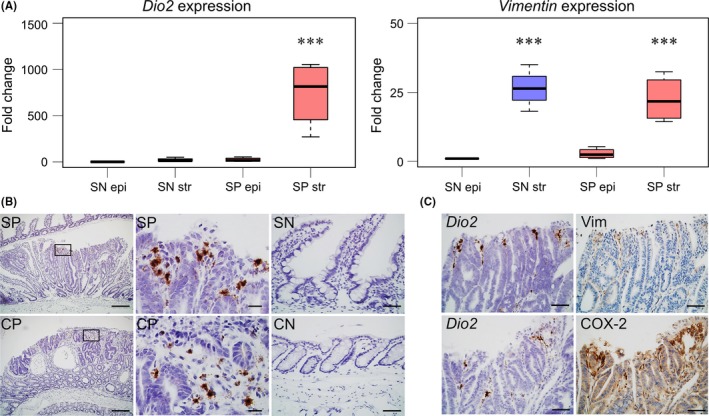
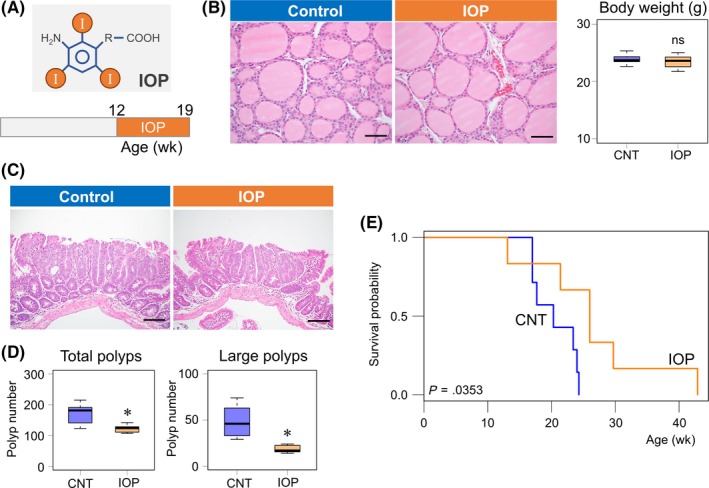
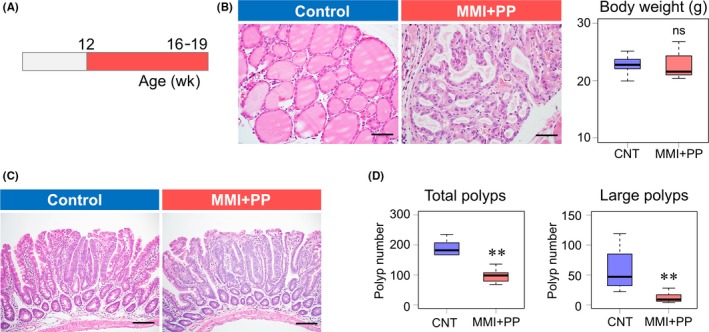
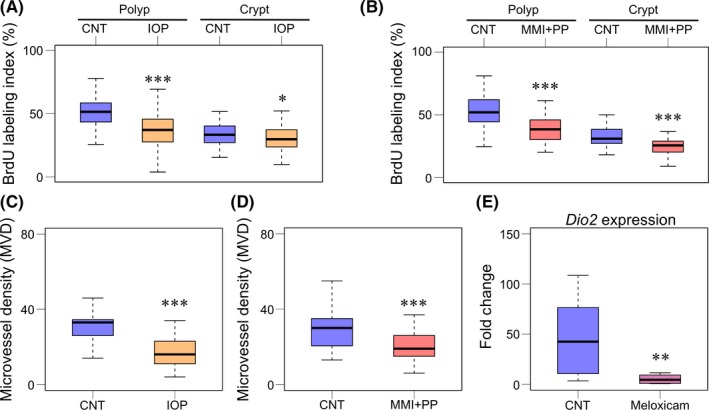
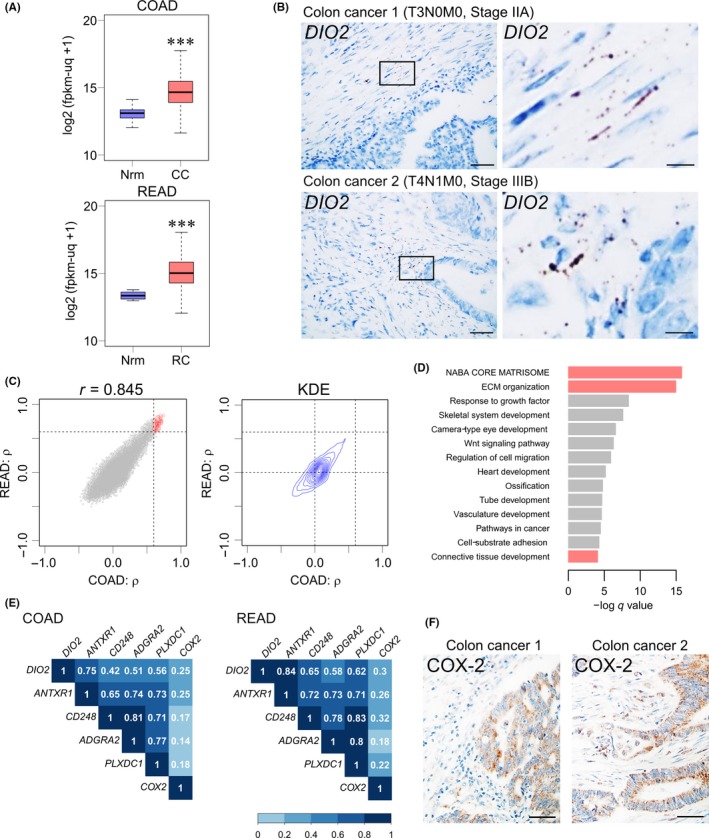
Iodothyronine deiodinase 2 (DIO2) converts the prohormone thyroxine (T4) to bioactive T3 in peripheral tissues and thereby regulates local thyroid hormone (TH) levels. Although epidemiologic studies suggest the contribution of TH to the progression of colorectal cancer (CRC), the role of DIO2 in CRC remains elusive. Here we show that Dio2 is highly expressed in intestinal polyps of ApcΔ716 mice, a mouse model of familial adenomatous polyposis and early stage sporadic CRC. Laser capture microdissection and in situ hybridization analysis show almost exclusive expression of Dio2 in the stroma of ApcΔ716 polyps in the proximity of the COX-2-positive areas. Treatment with iopanoic acid, a deiodinase inhibitor, or chemical thyroidectomy suppresses tumor formation in ApcΔ716 mice, accompanied by reduced tumor cell proliferation and angiogenesis. Dio2 expression in ApcΔ716 polyps is strongly suppressed by treatment with the COX-2 inhibitor meloxicam. Analysis of The Cancer Genome Atlas data shows upregulation of DIO2 in CRC clinical samples and a close association of its expression pattern with the stromal component, consistently with almost exclusive expression of DIO2 in the stroma of human CRC as revealed by in situ hybridization. These results indicate essential roles of stromal DIO2 and thyroid hormone signaling in promoting the growth of intestinal tumors.

Keywords: colorectal cancer; iodothyronine deiodinase 2; iopanoic acid; thyroid hormone; tumor angiogenesis.


Figures

Figure 1
Figure 1
Elevated expression of Dio2 in intestinal polyps of Apc Δ716 mice. A, Schematic diagram of deiodination of thyroxine (T4). DIO, iodothryonine deiodinase; I, iodine atom; rT3, 3,3′,5′‐triiodo‐l‐thyronine; T2, 3,3′‐diiodo‐l‐thyronine; T3, 3,3′,5‐triiodo‐l‐thyronine. B, Heat map of DNA microarray data of small intestinal (SI) normal mucosa and polyps (n = 3, each group). Colors were coded according to Z‐scored signal intensity. Thra, thyroid hormone receptor, α; Thrb, thyroid hormone receptor, β. C, Expression of Dio2 in normal and polyp tissues from Apc Δ716 mice analyzed by real‐time RTPCR. CN, normal colon; CP, colonic polyps; SN, normal small intestine; SP, small intestinal polyps. SN and SP, n = 7, P‐value = 9.56 × 10−5 by paired 2‐tailed t test on log‐transformed data. CN and CP, n = 8, P‐value = 8.99 × 10−6. ***P < .001 compared with SN or CN
Figure 2
Figure 2
Dio2 is expressed in the stromal region of Apc Δ716 tumors. A, Expression of Dio2 in epithelial (epi) and stromal compartment (str) of intestine tissues from Apc Δ716 mice analyzed by real‐time RTPCR. SN, normal small intestine; SP, small intestinal polyps. Tukey's all‐pairwise comparison test was applied. SN epi, SN str, SP epi, and SP str, n = 4, ***P < .001 compared with SN epi. B, In situ hybridization analysis of Dio2 mRNA in intestine tissues from Apc Δ716 mice. Bars: left panels, 200 μm; middle panels, 50 μm; right panels, 50 μm. C, In situ hybridization analysis of Dio2 mRNA and immunohistochemical analysis of vimentin (Vim) and COX‐2 in intestinal tissues from Apc Δ716 mice. Bars: 50 μm
Figure 3
Figure 3
Treatment with the iodothryonine deiodinase inhibitor iopanoic acid (IOP) suppresses intestinal tumor formation and prolongs the survival of Apc Δ716 mice. A, Schematic diagram of IOP structure and IOP treatment schedule. B, H&E staining of the thyroid glands from control and IOP‐treated Apc Δ716 mice. Box plots of the final body weight of the mice immediately before sampling. Control, 23.9 ± 0.9 g, n = 6; IOP, 23.4 ± 1.2 g, n = 7. Welch 2‐tailed t test, P = .499; ns, not significant. Bars: 50 μm. C, H&E staining of small intestinal polyp tissues from control and IOP‐treated Apc Δ716 mice. Bars: 100 μm. D, Number of total and large‐size polyps (≥1.5 mm) in control (CNT) and IOP‐treated Apc Δ716 mice. Total polyps: CNT, 172 ± 34, n = 6; IOP, 122 ± 13, n = 7; Welch 2‐tailed t test, P = .0136. Large‐size polyps: CNT, 49 ± 17, n = 6; IOP, 23 ± 14, n = 7. P = .0170. *P < .05 compared with CNT. E, Kaplan‐Meier survival curves of CNT (n = 7, blue) and IOP‐treated Apc Δ716 mice (n = 6, orange). IOP treatment was initiated at 8 wk of age. Median survival time: CNT, 20.3 wk; IOP, 26.0 wk; log rank test, P = .0353
Figure 4
Figure 4
Chemical thyroidectomy suppresses intestinal tumor formation. A, Schematic diagram of the schedule of chemical thyroidectomy with 2‐mercapto‐1‐methyl‐imidazole (MMI) and potassium perchlorate (PP). B, H&E staining of thyroid glands 3 mo after chemical thyroidectomy. Body weight of control and MMI + PP‐treated Apc Δ716 mice. Box plots of the final body weight of the mice immediately before sampling. Control, 22.8 ± 1.6 g, n = 9; MMI + PP, 22.7 ± 2.3 g, n = 9. Welch 2‐tailed t test, P = 0.897; ns, not significant. Bars: 50 μm. C, H&E staining of polyp tissues from control (CNT) and MMI + PP‐treated Apc Δ716 mice. Bars: 100 μm. D, Number of total and large‐size polyps (≥1.5 mm) in CNT and MMI + PP‐treated Apc Δ716 mice. Total polyps: CNT, 174 ± 49, n = 9; MMI + PP, 97 ± 35, n = 9; Welch 2‐tailed t test, P = .00178. Large‐size polyps: CNT, 63 ± 37, n = 9; MMI + PP, 12 ± 8, n = 9. P = .00317. **P < .01 compared with CNT
Figure 5
Figure 5
Deiodinase inhibition or chemical thyroidectomy reduces tumor cell proliferation and angiogenesis downstream of COX‐2 in Apc Δ716 polyps. A, BrdU labeling index (%) of intestinal polyps (left) and normal intestinal crypts (right) from control (CNT) and iopanoic acid (IOP)‐treated Apc Δ716 mice. Polyps: CNT, 51.4 ± 10.5%, n = 4; IOP, 36.8 ± 13.1%, n = 4. Welch 2‐tailed t test, P = 2.2 × 10−16. Normal crypts: CNT, 33.7 ± 9.1%, n = 4; IOP, 30.8 ± 10.1%, n = 4. P = 4.32 × 10−2. *P < .05, ***P < .001 compared with CNT. B, BrdU labeling index (%) of intestinal polyps (left) and normal intestinal crypts (right) from CNT and 2‐mercapto‐1‐methyl‐imidazole and potassium perchlorate (MMI + PP)‐treated Apc Δ716 mice. Polyps: CNT, 53.3 ± 11.5%, n = 4; MMI + PP, 39.5 ± 11.7%, n = 4. Welch 2‐tailed t test, P = 1.17 × 10−14. Normal crypts: CNT, 32.8 ± 7.6%, n = 4; MMI + PP, 25.3 ± 7.1%, n = 4. P = 4.82 × 10−8. ***P < .001 compared with control. C, Microvessel density (MVD) index of intestinal polyps from control and IOP‐treated Apc Δ716 mice. Control, 31.2 ± 9.3%, n = 4; IOP, 17.1 ± 7.8%, n = 5. P = 6.60 × 10−7. ***P < .001 compared with CNT. D, MVD index of intestinal polyps from control and MMI + PP‐treated Apc Δ716 mice. CNT, 29.1 ± 9.5%, n = 4; MMI + PP, 21.2 ± 10.1%, n = 4. P = 8.08 × 10−5. ***P < .001 compared with CNT. E, Real‐time RTPCR analysis for Dio2 mRNA expression level in intestinal polyps from CNT and meloxicam‐treated Apc Δ716 mice. CNT, n = 11; meloxicam, n = 8. P = 7.38 × 10−3 by paired 2‐tailed t test on log‐transformed data. **P < .01 compared with CNT
Figure 6
Figure 6
DIO2 expression is increased in the clinical samples of colorectal cancer. A, RNA sequencing analysis for DIO2 expression in colon and rectal cancer obtained from The Cancer Genome Atlas (TCGA) database (COAD and READ datasets). Unit of Y‐axis: log2(fpkm‐uq + 1). CC, colon cancer tissues; Nrm, normal colon or rectal tissue; RC, rectal cancer tissues. Normal colons, n = 41; colon cancers, n = 469, P = 2.2 × 10−16 by Welch 2‐tailed t test; normal rectums, n = 10; rectal cancers, n = 166, P = 3.35 × 10−9 by Welch 2‐tailed t test. ***P < .001 compared with the normal colonic or rectal tissue. B, In situ hybridization analysis of DIO2 mRNA in colon cancer clinical samples with hematoxylin counterstaining. Colon Cancer 1, T3N0M0, IIA; Colon Cancer 2, T4N1M0, Stage IIIB. Bars: left panels, 50 μm; right panels, 10 μm. C, Spearman's correlation coefficient (ρ) between expression levels of DIO2 and other genes in TCGA COAD (colon cancer) and TCGA READ (rectal cancer) datasets. X axis, ρ calculated from COAD; Y‐axis, ρ calculated from READ; dashed lines, ρ = 0.6; red circles, selected 195 genes. Two‐dimensional kernel density estimation (KDE); dashed lines, ρ = 0.0 and ρ = 0.6. D, Enrichment analysis of selected 195 genes that were highly coexpressed with DIO2 mRNA in colon and rectal cancer tissues. Red bars, clustering enrichment terms related to ECM. E, Spearman's correlation matrix heat map between DIO2 and tumor endothelial markers (ANTXR1,CD248,ADGRA2, and PLXDC1) and COX‐2 in TCGA COAD and TCGA READ datasets. F, Immunohistochemical analysis of COX‐2 in colon cancer clinical samples with hematoxylin counterstaining. COX‐2 is expressed both in the stromal and epithelial regions. Colon Cancer 1, T3N0M0, IIA; Colon Cancer 2, T4N1M0, Stage IIIB. Bars: 50 μm

Similar articles

Cited by

References

    1. Brent Ga. Mechanisms of thyroid hormone action. J Clin Invest. 2012;122:3035‐3043. - PMC - PubMed
    1. Sirakov M, Plateroti M. The thyroid hormones and their nuclear receptors in the gut: from developmental biology to cancer. Biochim Biophys Acta. 2011;1812:938‐946. - PubMed
    1. Frau C, Godart M, Plateroti M. Thyroid hormone regulation of intestinal epithelial stem cell biology. Mol Cell Endocrinol. 2017;459:90‐97. - PubMed
    1. Goemann IM, Romitti M, Meyer ELS, Wajner SM, Maia AL. Role of thyroid hormones in the neoplastic process: an overview. Endocr Relat Cancer. 2017;24:R367‐R385. - PubMed
    1. Rennert G, Rennert HS, Pinchev M, Gruber SB. A case–control study of levothyroxine and the risk of colorectal cancer. J Natl Cancer Inst. 2010;102:568‐572. - PMC - PubMed

MeSH terms

Associated data