

Beyond dichotomy: patterns and amplitudes of SSEPs and neurological outcomes after cardiac arrest
- PMID: 31215475
- PMCID: PMC6582536
- DOI: 10.1186/s13054-019-2510-x
Beyond dichotomy: patterns and amplitudes of SSEPs and neurological outcomes after cardiac arrest
Abstract
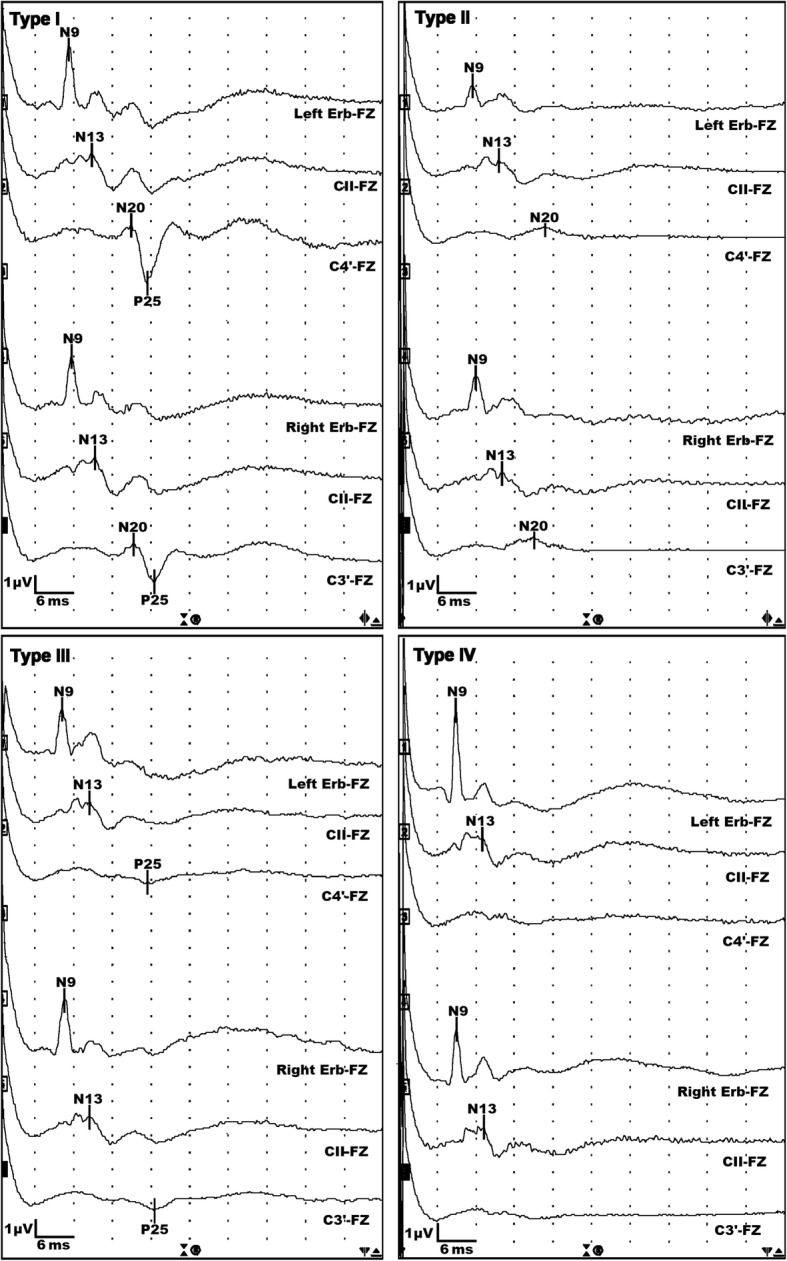
Background: We hypothesized that the absence of P25 and the N20-P25 amplitude in somatosensory evoked potentials (SSEPs) have higher sensitivity than the absence of N20 for poor neurological outcomes, and we evaluated the ability of SSEPs to predict long-term outcomes using pattern and amplitude analyses.
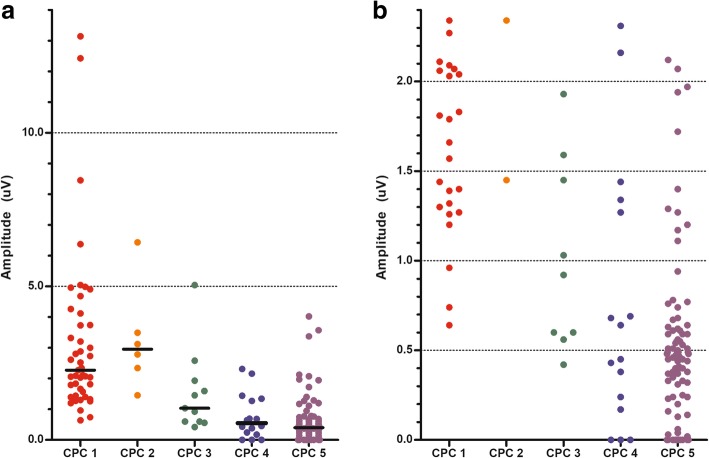
Methods: Using prospectively collected therapeutic hypothermia registry data, we evaluated whether cortical SSEPs contained a negative or positive short-latency wave (N20 or P25). The N20-P25 amplitude was defined as the largest difference in amplitude between the N20 and P25 peaks. A good or poor outcome was defined as a Glasgow-Pittsburgh Cerebral Performance Category (CPC) score of 1-2 or 3-5, respectively, 6 months after cardiac arrest.
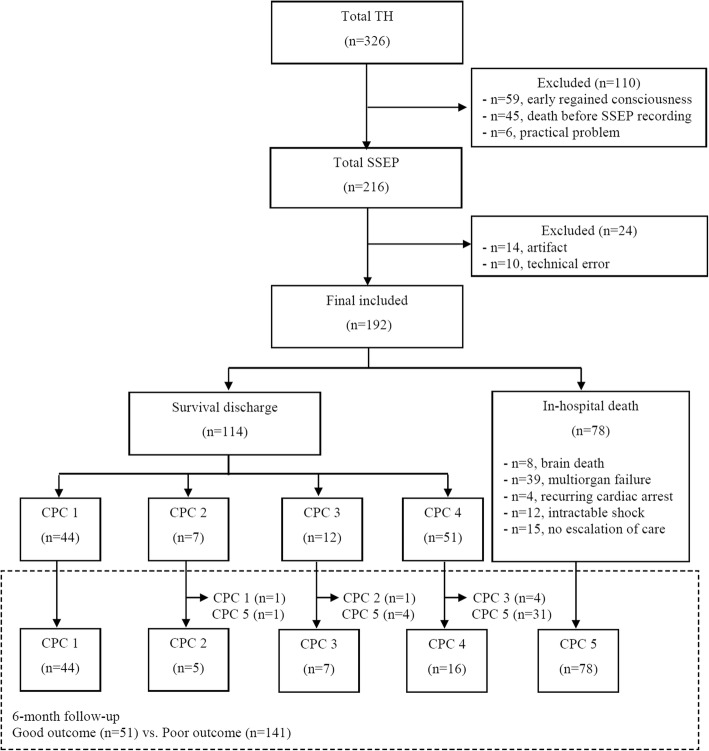
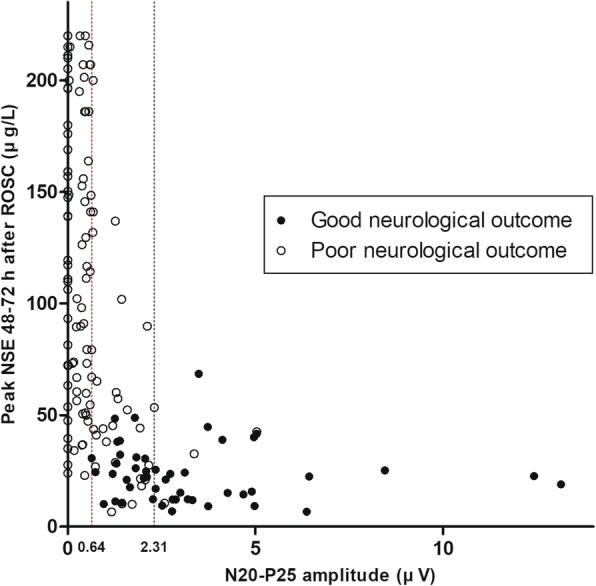
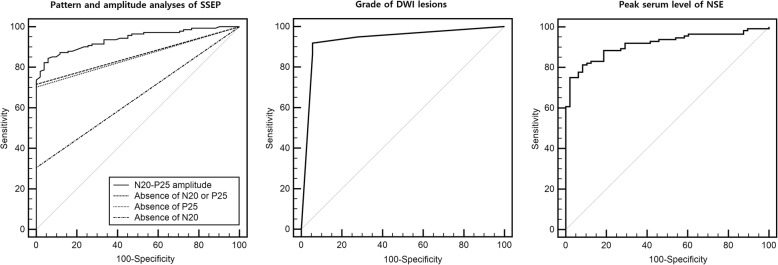
Results: A total of 192 SSEP recordings were included. In all patients with a good outcome (n = 51), both N20 and P25 were present. Compared to the absence of N20, the absence of N20-P25 component improved the sensitivity for predicting a poor outcome from 30.5% (95% confidence interval [CI], 23.0-38.8%) to 71.6% (95% CI, 63.4-78.9%), while maintaining a specificity of 100% (93.0-100.0%). Using an amplitude < 0.64 μV, i.e., the lowest N20-P25 amplitude in the good outcome group, as the threshold, the sensitivity for predicting a poor neurological outcome was 74.5% (95% CI, 66.5-81.4%). Using the highest N20-P25 amplitude in the CPC 4 group (2.31 μV) as the threshold for predicting a good outcome, the sensitivity and specificity were 52.9% (95% CI, 38.5-67.1%) and 96.5% (95% CI, 91.9-98.8%), respectively. The predictive performance of the N20-P25 amplitude was good, with an area under the receiver operating characteristic curve (AUC) of 0.94 (95% CI, 0.90-0.97). The absence of N20 was statistically inferior regarding outcome prediction (p < 0.05), and amplitude analysis yielded significantly higher AUC values than did the pattern analysis (p < 0.05).
Conclusions: The simple pattern analysis of whether the N20-P25 component was present had a sensitivity comparable to that of the N20-P25 amplitude for predicting a poor outcome. Amplitude analysis was also capable of predicting a good outcome.
Keywords: Evoked potentials; Heart arrest; Induced hypothermia; Prognosis.
Conflict of interest statement
The authors declare that they have no competing interests.
Figures
Similar articles
-
Prognostic Value of P25/30 Cortical Somatosensory Evoked Potential Amplitude After Cardiac Arrest.Crit Care Med. 2020 Sep;48(9):1304-1311. doi: 10.1097/CCM.0000000000004460. Crit Care Med. 2020. PMID: 32568854
-
N20-P25 Amplitude can Predict Awakening from Coma.Neurocrit Care. 2025 Aug 11. doi: 10.1007/s12028-025-02335-9. Online ahead of print. Neurocrit Care. 2025. PMID: 40789803
-
Short-Latency Positive Peak Following N20 Somatosensory Evoked Potential Is Superior to N20 in Predicting Neurologic Outcome After Out-of-Hospital Cardiac Arrest.Crit Care Med. 2018 Jun;46(6):e545-e551. doi: 10.1097/CCM.0000000000003083. Crit Care Med. 2018. PMID: 29498940
-
Prognostication of neurologic outcome in cardiac arrest patients after mild therapeutic hypothermia: a meta-analysis of the current literature.Intensive Care Med. 2013 Oct;39(10):1671-82. doi: 10.1007/s00134-013-3004-y. Epub 2013 Jun 26. Intensive Care Med. 2013. PMID: 23801384 Review.
-
SSEP retains its value as predictor of poor outcome following cardiac arrest in the era of therapeutic hypothermia.Crit Care. 2019 Oct 23;23(1):327. doi: 10.1186/s13054-019-2576-5. Crit Care. 2019. PMID: 31647028 Free PMC article. Review.
Cited by
-
2020 Korean Guidelines for Cardiopulmonary Resuscitation. Part 5. Post-cardiac arrest care.Clin Exp Emerg Med. 2021 May;8(S):S41-S64. doi: 10.15441/ceem.21.025. Epub 2021 May 21. Clin Exp Emerg Med. 2021. PMID: 34034449 Free PMC article. No abstract available.
-
Short-Acting Neuromuscular Blockade Improves Inter-rater Reliability of Median Somatosensory Evoked Potentials in Post-cardiac arrest Prognostication.Neurocrit Care. 2023 Jun;38(3):600-611. doi: 10.1007/s12028-022-01601-4. Epub 2022 Sep 19. Neurocrit Care. 2023. PMID: 36123569 Clinical Trial.
-
The effect of Glibenclamide on somatosensory evoked potentials after cardiac arrest in rats.Neurocrit Care. 2022 Apr;36(2):612-620. doi: 10.1007/s12028-021-01350-w. Epub 2021 Oct 1. Neurocrit Care. 2022. PMID: 34599418 Free PMC article.
-
Association of ultra-early diffusion-weighted magnetic resonance imaging with neurological outcomes after out-of-hospital cardiac arrest.Crit Care. 2023 Jan 13;27(1):16. doi: 10.1186/s13054-023-04305-z. Crit Care. 2023. PMID: 36639809 Free PMC article.
-
The Influence of Therapeutics on Prognostication After Cardiac Arrest.Curr Treat Options Neurol. 2019 Nov 25;21(12):60. doi: 10.1007/s11940-019-0602-1. Curr Treat Options Neurol. 2019. PMID: 31768661 Review.
References
-
- Callaway CW, Donnino MW, Fink EL, Geocadin RG, Golan E, Kern KB, et al. Part 8: post-cardiac arrest care: 2015 American Heart Association guidelines update for cardiopulmonary resuscitation and emergency cardiovascular care. Circulation. 2015;132:S465–S482. doi: 10.1161/CIR.0000000000000262. - DOI - PMC - PubMed
MeSH terms
Grants and funding
LinkOut - more resources
Full Text Sources
Medical
