. 2019 Jun 18;38(1):265.
doi: 10.1186/s13046-019-1251-7.

Ivermectin reverses the drug resistance in cancer cells through EGFR/ERK/Akt/NF-κB pathway

Affiliations

Ivermectin reverses the drug resistance in cancer cells through EGFR/ERK/Akt/NF-κB pathway

Lu Jiang et al. J Exp Clin Cancer Res. .

Abstract

Background: Discovery and development of novel drugs that are capable of overcoming drug resistance in tumor cells are urgently needed clinically. In this study, we sought to explore whether ivermectin (IVM), a macrolide antiparasitic agent, could overcome the resistance of cancer cells to the therapeutic drugs.

Methods: We used two solid tumor cell lines (HCT-8 colorectal cancer cells and MCF-7 breast cancer cells) and one hematologic tumor cell line (K562 chronic myeloid leukemia cells), which are resistant to the chemotherapeutic drugs vincristine and adriamycin respectively, and two xenograft mice models, including the solid tumor model in nude mice with the resistant HCT-8 cells and the leukemia model in NOD/SCID mice with the resistant K562 cells to investigate the reversal effect of IVM on the resistance in vitro and in vivo. MTT assay was used to investigate the effect of IVM on cancer cells growth in vitro. Flow cytometry, immunohistochemistry, and immunofluorescence were performed to investigate the reversal effect of IVM in vivo. Western blotting, qPCR, luciferase reporter assay and ChIP assay were used to detect the molecular mechanism of the reversal effect. Octet RED96 system and Co-IP were used to determine the interactions between IVM and EGFR.

Results: Our results indicated that ivermectin at its very low dose, which did not induce obvious cytotoxicity, drastically reversed the resistance of the tumor cells to the chemotherapeutic drugs both in vitro and in vivo. Mechanistically, ivermectin reversed the resistance mainly by reducing the expression of P-glycoprotein (P-gp) via inhibiting the epidermal growth factor receptor (EGFR), not by directly inhibiting P-gp activity. Ivermectin bound with the extracellular domain of EGFR, which inhibited the activation of EGFR and its downstream signaling cascade ERK/Akt/NF-κB. The inhibition of the transcriptional factor NF-κB led to the reduced P-gp transcription.

Conclusions: These findings demonstrated that ivermectin significantly enhanced the anti-cancer efficacy of chemotherapeutic drugs to tumor cells, especially in the drug-resistant cells. Thus, ivermectin, a FDA-approved antiparasitic drug, could potentially be used in combination with chemotherapeutic agents to treat cancers and in particular, the drug-resistant cancers.

Keywords: Drug resistance; EGFR; Ivermectin; P-glycoprotein; Reversal.


Conflict of interest statement

The authors declare that they have no competing interests.

Figures

Fig. 1
Fig. 1
Ivermectin increased the sensitivity of the cells to chemotherapeutic drugs. a-c The cell viability of sensitive or resistant HCT-8 cells (a), MCF-7 cells (b) and K562 cells (c) after treated with vincristine or adriamycin with or without different concentrations of ivermectin (IVM) for 48 h. Cell viability was determined by MTT assay. The numbers in the figure keys represent the concentrations (μM) of IVM. Cells treated with vehicle serve as a blank control. Abbreviations: IVM, ivermectin; S, vincristine-sensitive HCT-8 cells; R, vincristine-resistant HCT-8 cells; SM, adriamycin-sensitive MCF-7 cells; RM, adriamycin-resistant MCF-7 cells; SK, adriamycin-sensitive K562 cells; RK, adriamycin-resistant K562 cells. All experiments were conducted in quintuplicates and data were expressed as the mean ± SD (n = 5)
Fig. 2
Fig. 2
Ivermectin enhances the anti-tumor effect of vincristine in solid tumor xenografts. The nude mice were injected subcutaneously with 1×10⁷ HCT-8 cells, which are sensitive or resistant to vincristine (VCR). When the tumor reached to about 100 mm3, the mice were treated with ivermectin (IVM) (2 mg/kg) and/or VCR (0.2 mg/kg) by intraperitoneal injection daily for 27 days. a Changes of tumor volumes from day 0 to day 27; b-d Volumes (b), weights (c) and images (d) of the tumors on day 27. Mice treated with vehicle serve as control. The weights and volumes of the tumors in the control xenografts were 1.97 ± 0.12 g and 2794.5 ± 384.8 mm3 (in S group) vs 1.12 ± 0.11 g and 1654.8 ± 342.6 mm3 (in R group), respectively. Abbreviations: CTL, control; IVM, ivermectin; VCR, vincristine; S, vincristine-sensitive HCT-8 xenograft; R, vincristine-resistant HCT-8 xenograft. Data in a-c represent the mean ± SD (n = 6 mice each group). Statistical significances were determined using one-way ANOVA followed by Dunnett’s test. *P < 0.05, **P < 0.01, compared with the respective vehicle controls (blue columns/lines); #P < 0.05, compared with the corresponding columns with the same color in the S group; &P < 0.05, &&P < 0.01, comparison between the two columns or lines
Fig. 3
Fig. 3
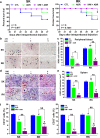
Ivermectin enhances the anti-cancer effect of adriamycin in a mice model for human leukemia. The NOD/SCID mice were injected through tail vein with 2×10⁷ K562 cells, which are sensitive or resistant to adriamycin (ADR). Then, the mice were treated with ADR (0.3 mg/kg, i.p.) alone or combined with ivermectin (IVM) (2 mg/kg, i.p.) daily for 27 days. a Survival percentage of the mice were calculated. b and c The May-Grünwald Giemsa (MGG) staining (b) and the K562 cell numbers (c) of the peripheral blood smear from the mice were determined. Scale bars: 150 μm. d The histopathological examination of spleen with hematoxylin and eosin (H & E) staining. Scale bars: 150 μm. The arrowheads indicate the K562 cells. The images within the red rectangles were enlarged as insets (scale bars: 30 μm). e The K562 cell numbers in spleen were determined based on the spleen H & E staining results. f The percentage of cells stained positive for cell surface markers CD13 or CD33 in bone marrow were determined by flow cytometry. Abbreviations: CTL, control; SK, adriamycin-sensitive K562 xenograft; RK, adriamycin-resistant K562 xenograft. Data represent the mean ± SD (n = 6). Statistical significances in a were determined by using the log-rank test. Statistical significances in c, e, and f were determined by using one-way ANOVA followed by Dunnett’s test. *P < 0.05, **P < 0.01, compared with the respective vehicle controls (blue columns); #P < 0.05, ##P < 0.01, compared with the corresponding columns with the same color in the SK group; &P < 0.05, &&P < 0.01, comparison between the two columns (purple column vs green column)
Fig. 4
Fig. 4
Ivermectin inhibited P-gp expression and increased the intracellular drug accumulation. a-c Protein level of P-gp (a), mRNA level of MDR1 (b), or intracellular VCR concentrations (c) in HCT-8 cells treated with 25 nM VCR and/or 3 μM ivermectin (IVM) for 48 h were determined. The protein level was detected by Western blotting analysis and mRNA level was determined by qPCR using GAPDH as the internal control, and intracellular VCR concentrations were determined by HPLC. d and e Cell viability of HCT-8 cells transfected with the plasmid pGenesil-P-gp (P-gp shRNA) (d) or the plasmid pcDNA3.1(+)-P-gp (e) and then treated with 25 nM VCR and/or 3 μM IVM for 48 h. Cell viability was detected by MTT assay. Cells transfected with control shRNA (shCtrl)/empty vector pcDNA3.1(+) (mock) or treated with vehicle serve as control. f The P-gp expression in the HCT-8 xenografts was detected by immunofluorescence (upper panel) and immunohistochemical staining (lower panel). Green: P-gp protein. Scale bars: 200 μm. g VCR accumulation in tumor tissues of the mice was determined by HPLC analysis. Abbreviations: IVM, ivermectin; VCR, vincristine; S, vincristine-sensitive HCT-8 cells/xenografts; R, vincristine-resistant HCT-8 cells/xenografts. Data in a is the representative of three independent experiments. Data in b and c represent the mean ± SD (n = 3). Data in d and e represent the mean ± SD (n = 5). Data in g represent the mean ± SD (n = 6 mice in each group). Statistical significances were determined using one-way ANOVA followed by Dunnett’s test. *P < 0.05, **P < 0.01, compared with the respective vechicle controls; #P < 0.05, ##P < 0.01, compared with the corresponding columns with the same color in the S group; &P < 0.05, &&P < 0.01, comparison between the two columns
Fig. 5
Fig. 5
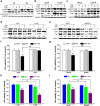
Ivermectin decreased P-gp expression by inhibiting the EGFR activation. a The expression levels of the proteins in the VCR-resistant/sensitive HCT-8 cells treated with 25 nM VCR and/or 3 μM IVM for 48 h were detected. b-i The expression levels of the proteins (b-e) and the cell viability (f-i) of the VCR-resistant HCT-8 cells untransfected (b, d, f, and h) or transfected with the plasmid pcDNA3.1(+)-EGFR (c and g) or siRNA for EGFR (e and i), treated with 25 nM VCR and/or 3 μM IVM in the presence or absence of 8 nM EGF (b and f) or 1 μM lapatinib (LAP), an EGFR inhibitor (d and h), for 48 h were determined. Cell viability was detected by MTT assay and the protein expression levels were detected by Western blotting analysis using GAPDH as internal control. Cells treated with vehicle, or transfected with empty vector pcDNA3.1(+) (mock)/control siRNA (siCtrl) serve as control. Abbreviations: EGF, epidermal growth factor; IVM, ivermectin; VCR, vincristine; S, vincristine-sensitive HCT-8 cells; R, vincristine-resistant HCT-8 cells. Data in a-e are the representative of two independent experiments. Data in f-i represent the percentage of respective control values (mean ± SD, n = 5). Statistical significances in f-i were determined using one-way ANOVA followed by Dunnett’s test. *P < 0.05 and **P < 0.01, compared with the respective controls; #P < 0.05 and ##P < 0.01, comparison between the two columns
Fig. 6
Fig. 6
The effect of IVM on the EGFR signaling pathway. a-g The cell viability (a, b, and e), the protein expression levels of p-EGFR/EGFR and P-gp (c and f), and the mRNA level of MDR1 (d and g) of HCT-116 cells (WT) and EGFR knockout HCT-116 cells (EGFR-KO) treated with different concentrations of IVM or VCR (a), or treated with VCR in the presence of IVM (b, c) or LAP (e, f) or treated with IVM alone (d) or LAP alone (g) for 48 h were determined. The numbers in the figure keys in b and e represent the concentrations (μM) of IVM or LAP. h The cell viability of the VCR-resistant HCT-8 cells pretreated with IVM or VRP for 48 h, and then treated with VCR alone or VCR plus IVM, or VCR plus VRP for another 48 h were detected. Cell viability was determined by MTT assay and the protein expression levels were detected by Western blotting analysis using GAPDH as internal control. Cells treated with vehicle serve as control. Abbreviations: IVM, ivermectin; LAP, lapatinib; VCR, vincristine; VRP: verapamil; WT, HCT-116 cell; EGFR-KO, EGFR-knockout HCT-116 cells. Data in a, b, and e were conducted in quintuplicates and data were expressed as the mean ± SD (n = 5). Data in c and f are the representative of two independent experiments. Data in d and g are expressed as the mean ± SD (n = 3). Data in h represent the percentage of respective control values (mean ± SD, n = 5). Statistical significances in d, g, and h were determined using one-way ANOVA followed by Dunnett’s test. **P < 0.01, compared with the respective vehicle controls; #P < 0.05, ##P < 0.01, comparison between the two columns; ns, no significance (P > 0.05), comparison between the two columns
Fig. 7
Fig. 7
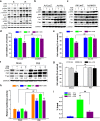
Ivermectin decreased P-gp expression through inhibiting ERK/Akt and NF-κB activation. a The expression levels of the proteins of the VCR-resistant/sensitive HCT-8 cells treated with 25 nM vincristine (VCR) and/or 3 μM ivermectin (IVM) for 48 h were determined. b-h Expression levels of the proteins (b, c, f), the cell viability (d, e, g), and the relative MDR1 promoter activity (h) of the VCR-resistant HCT-8 cells infected by recombinant adenovirus expressing HA-tagged constitutively active Akt (Ad-Akt-myr) (b and e) or by the flag-tagged constitutively active MKK1 (Ad-MKK1-R4F) (c and d), or transfected with plasmid pcDNA3.1(+)-P65, treated with 25 nM VCR and/or 3 μM IVM for 48 h were determined. i Chromatin IP was carried out with IgG (negative control) and anti-P65 antibody. Q-PCR result for MDR1 promoter region was shown as the percentage of input DNA. Cell viability was detected by MTT assay and the protein expression levels were detected by Western blotting analysis using GAPDH as internal control. Relative MDR1 promoter activity was determined by Gaussia luciferase activity normalized to the transfection control, i.e., secreted alkaline phosphatase (SeAP). Cells treated with recombinant adenovirus expressing Ad-LacZ or with empty vector pcDNA3.1(+) (mock) serve as control. Abbreviations: CTL, control; IVM, ivermectin; VCR, vincristine; S, vincristine-sensitive cells; R, vincristine-resistant cells. Western blots in a-c and f are representative of two independent experiments. Data in d, e, and g represent the percentage of respective control values (mean ± SD, n = 5). Data in h are expressed as fold change of the activity over the control from the mock group (mean ± SD, n = 3). Data in i are expressed as the mean ± SD (n = 4). Statistical significances in d, e, and g-i were determined using one-way ANOVA followed by Dunnett’s test. *P < 0.05, **P < 0.01, compared with the respective controls; ##P < 0.01, comparison between the two columns
Fig. 8
Fig. 8
Ivermectin directly binds to EGFR. a Co-immunoprecipitation assay in HCT-8 cells treated with 3 μM IVM for 4 h with or without 10 nM EGF pretreatment for 2 h. Cell lysates were immunoprecipitated with non-specific IgG or anti-AVMs antibody that can cross-react with ABM and IVM. HCT-8 cells treated with ABM serve as positive control for the IP with anti-AVMs antibody. ‘IgG’ indicates the vehicle-treated cell lysates immunoprecipitated with non-specific IgG. ‘Input’ indicates the whole cell lysates. b-d Binding response (nm) between EGFR extracellular domain and different concentrations of ivermectin (IVM) (b), epidermal growth factor (EGF) (c) or the mixture of different concentrations of IVM with 25 nM EGF (d) was measured by Octet RED96 system. Abbreviations: IVM, ivermectin; ABM, abamectin; AVMs, avermectins; EGF, epidermal growth factor; EGFR, epithelial growth factor receptor. Western blots are representative of two independent experiments

Similar articles

Cited by

References

    1. Kartal-Yandim M, Adan-Gokbulut A, Baran Y. Molecular mechanisms of drug resistance and its reversal in cancer. Crit Rev Biotechnol. 2016;36:716–726. - PubMed
    1. Robak P, Drozdz I, Szemraj J, Robak T. Drug resistance in multiple myeloma. Cancer Treat Rev. 2018;70:199–208. doi: 10.1016/j.ctrv.2018.09.001. - DOI - PubMed
    1. Hasanovic A, Mus-Veteau I. Targeting the multidrug transporter ptch1 potentiates chemotherapy efficiency. Cells. 2018;7(8):E107. doi: 10.3390/cells7080107. - DOI - PMC - PubMed
    1. Gottesman MM, Fojo T, Bates SE. Multidrug resistance in cancer: role of ATP-dependent transporters. Nat Rev Cancer. 2002;2:48–58. doi: 10.1038/nrc706. - DOI - PubMed
    1. Saeed MEM, Mahmoud N, Sugimoto Y, Efferth T, Abdel-Aziz H. Molecular determinants of sensitivity or resistance of cancer cells toward sanguinarine. Front Pharmacol. 2018;9:e136. doi: 10.3389/fphar.2018.00136. - DOI - PMC - PubMed

MeSH terms