. 2019 Jun 19;142(7):1876-1886.
doi: 10.1093/brain/awz115. Online ahead of print.

MSH3 modifies somatic instability and disease severity in Huntington's and myotonic dystrophy type 1

Affiliations

MSH3 modifies somatic instability and disease severity in Huntington's and myotonic dystrophy type 1

Michael Flower et al. Brain. .

Abstract

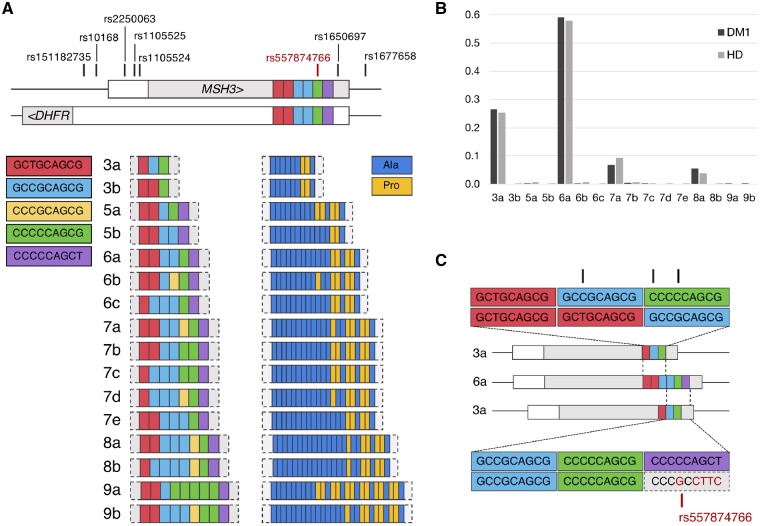
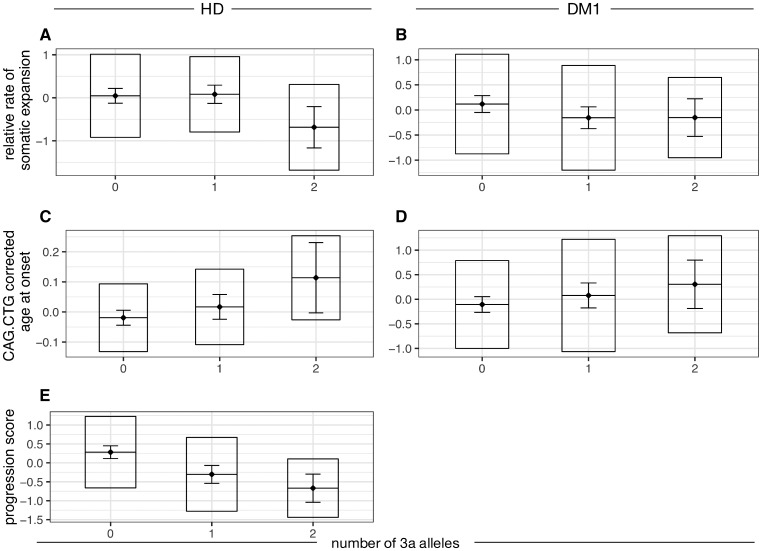
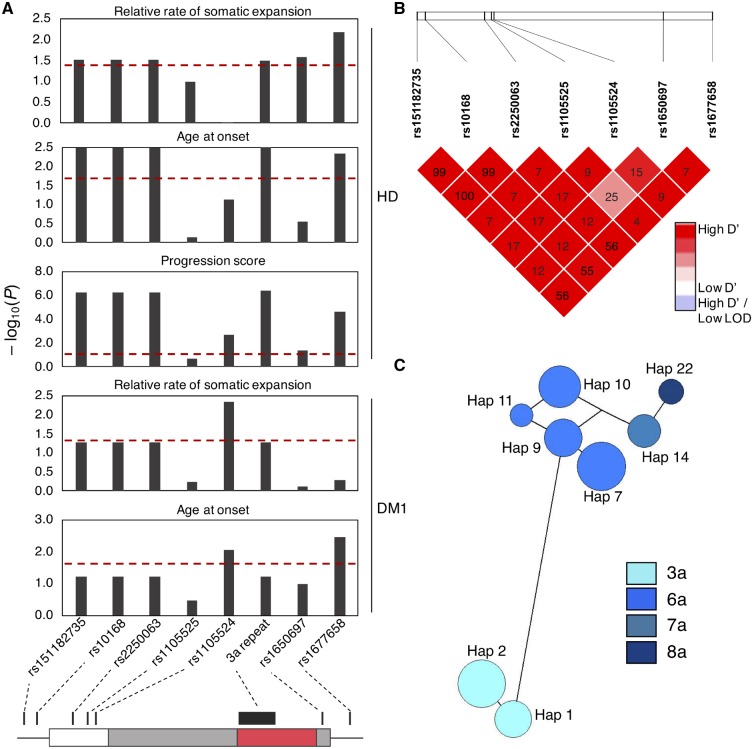
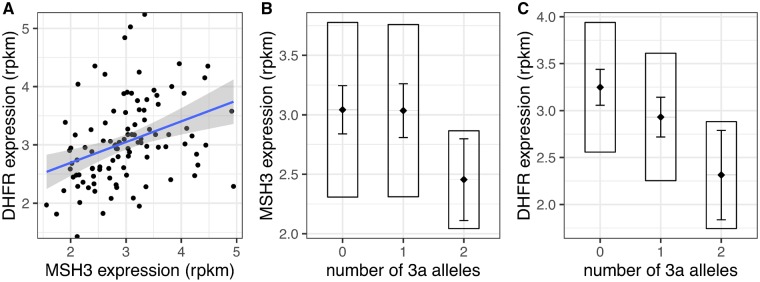
The mismatch repair gene MSH3 has been implicated as a genetic modifier of the CAG·CTG repeat expansion disorders Huntington's disease and myotonic dystrophy type 1. A recent Huntington's disease genome-wide association study found rs557874766, an imputed single nucleotide polymorphism located within a polymorphic 9 bp tandem repeat in MSH3/DHFR, as the variant most significantly associated with progression in Huntington's disease. Using Illumina sequencing in Huntington's disease and myotonic dystrophy type 1 subjects, we show that rs557874766 is an alignment artefact, the minor allele for which corresponds to a three-repeat allele in MSH3 exon 1 that is associated with a reduced rate of somatic CAG·CTG expansion (P = 0.004) and delayed disease onset (P = 0.003) in both Huntington's disease and myotonic dystrophy type 1, and slower progression (P = 3.86 × 10⁻⁷) in Huntington's disease. RNA-Seq of whole blood in the Huntington's disease subjects found that repeat variants are associated with MSH3 and DHFR expression. A transcriptome-wide association study in the Huntington's disease cohort found increased MSH3 and DHFR expression are associated with disease progression. These results suggest that variation in the MSH3 exon 1 repeat region influences somatic expansion and disease phenotype in Huntington's disease and myotonic dystrophy type 1, and suggests a common DNA repair mechanism operates in both repeat expansion diseases.

Keywords: Huntington’s disease; association study; movement disorders; myotonic dystrophy; transcriptomics.


Figures

Figure 1
Figure 1
MSH3/DHFR 9bp tandem repeat allele structure and frequency observed in Huntington’s disease and DM1 cohorts. (A) Schematic representation of the 9 bp tandem repeat alleles observed in this study and their coding potential. Repeat units are colour-coded by DNA and amino acid sequence. Location of the repeat and flanking variants in relation to MSH3/DHFR locus are shown in the top panel. This locus contains overlapping MSH3 exon 1 and DHFR promoter regions. For both MSH3 and DHFR, the 5’-untranslated region is shown in white and coding sequence in light grey. The direction of transcription is indicated by arrows for each gene. (B) Repeat allele frequencies observed in Huntington’s disease (HD) and DM1. Four common alleles, 3a, 6a, 7a and 8a, are observed in Huntington’s disease and DM1 cohorts at similar frequencies. (C) Schematic showing potential misalignments of 3a and 6a alleles, resulting in the apparent SNP rs557874766, shown in red on the lower alignment. Black marks in the top alignment represent mismatches that could be created in a similar manner as rs557874766, by misalignment of the 3a and 6a repeat alleles.
Figure 2
Figure 2
The number of MSH3 3a repeat alleles is associated with Huntington’s disease and DM1 phenotypes. Boxplots for three measures of disease phenotype are shown: rate of somatic expansion corrected for the inherited CAG·CTG length in Huntington’s disease (A) and for the inherited CAG·CTG length and variant repeats in DM1 (B); age at onset corrected for the inherited CAG·CTG length in Huntington’s disease (C) and DM1 (D); progression score in Huntington’s disease (E). For each dataset, the diamond and horizontal line spanning the diamond indicate the mean, the box the standard deviation and the whiskers the 95% confidence intervals of the mean. HD = Huntington’s disease.
Figure 3
Figure 3
Variants at the MSH3/DHFR locus are associated with phenotypes in Huntington’s disease and DM1. (A) Bar charts showing associations between variant genotypes and disease phenotypes: relative rate of somatic expansion and age at onset corrected for the CAG·CTG length and progression score for Huntington’s disease, and rate of somatic expansion and age at onset corrected for the CAG·CTG length and repeat interruptions for DM1. Each bar represents association for a single variant. Red dotted line represents the P = 0.05 significance threshold. Variant location in relation to the MSH3 exon 1 region is shown in the bottom panel. White box = 5’ untranslated region; grey = coding sequence; red = MSH3 repeat region; intron is shown by a black line. (B) Linkage disequilibrium heat map for the seven variants flanking the MSH3 repeat. Colour intensity represents the D’ value for each SNP pair. R2 values are indicated in text for each variant pair. (C) Haplotype network for eight haplotypes with frequency > 0.035 observed at the MSH3 exon 1 region. Circles represent different haplotypes. The size of the circle is proportional to the number of individuals with a particular haplotype. Each haplotype is connected with the most similar haplotype by a line. Length of the line represents the number of genotypes that are different between each two haplotypes. Circles are colour coded according to the repeat allele found on the haplotype.
Figure 4
Figure 4
Association of the MSH3 3a allele with MSH3 and DHFR expression in Huntington’s disease whole blood. Whole blood RNA-Seq in a subset of 108 Huntington’s disease subjects. (A) Significant correlation between MSH3 and DHFR expression levels (r2 = 0.120, P = 2.06 × 10⁻⁴). Grey area around the blue regression line represents 95% confidence interval of the model. (B) Homozygosity for MSH3 3a repeat allele is associated with lower MSH3 expression in blood (P = 0.028). (C) MSH3 3a repeat allele is associated with lower DHFR expression (P = 2.33 × 10⁻⁴). Rpkm = reads per kilobase of transcript per million mapped reads. In boxplots, the diamond and horizontal line spanning the diamond indicate the mean, the box indicates the standard deviation and the whiskers indicate the 95% confidence intervals of the mean.

Comment in

References

    1. Ashizawa T, Dubel JR, Harati Y. Somatic instability of CTG repeat in myotonic dystrophy. Neurology 1993; 43: 2674–8. - PubMed
    1. Bandelt HJ, Forster P, Rohl A. Median-joining networks for inferring intraspecific phylogenies. Mol Biol Evol 1999; 16: 37–48. - PubMed
    1. Bates G, Tabrizi S, Jones L. Huntington’s disease. Oxford: Oxford University Press; 2014.
    1. Bates GP, Dorsey R, Gusella JF, Hayden MR, Kay C, Leavitt BR, et al.Huntington disease. Nat Rev Dis Primers 2015; 1: 15005. - PubMed
    1. Bettencourt C, Hensman-Moss D, Flower M, Wiethoff S, Brice A, Goizet C, et al.DNA repair pathways underlie a common genetic mechanism modulating onset in polyglutamine diseases. Ann Neurol 2016; 79: 983–90. - PMC - PubMed