

A robust implicit measure of facial attractiveness discrimination
- PMID: 31216033
- PMCID: PMC6778828
- DOI: 10.1093/scan/nsz043
A robust implicit measure of facial attractiveness discrimination
Abstract
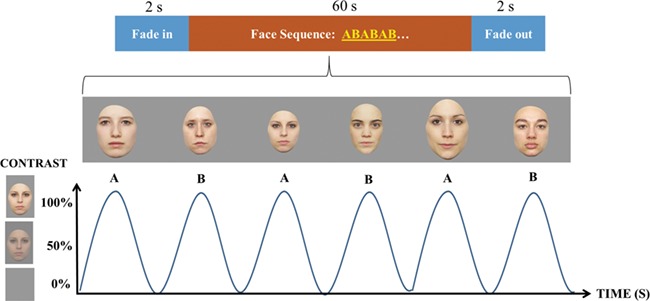
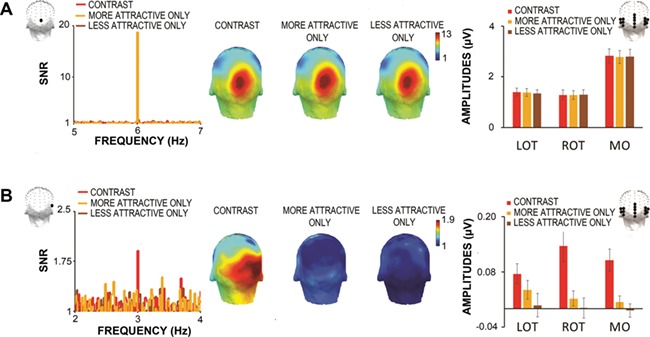
Decisions of attractiveness from the human face are made instantly and spontaneously, but robust implicit neural measures of facial attractiveness discrimination are currently lacking. Here we applied fast periodic visual stimulation coupled with electroencephalography (EEG) to objectively measure the neural coding of facial attractiveness. We presented different pictures of faces at 6 Hz, i.e. six faces/second, for a minute while participants attended to a central fixation cross and indicated whether the cross shortly changed color. Every other face in the stimulation was attractive and was replaced by a relatively less attractive face. This resulted in alternating more/less attractive faces at a 3 Hz rate, eliciting a significant increase in occipito-temporal EEG amplitude at 3 Hz both at the group and the individual participant level. This response was absent in two control conditions where either only attractive or only less attractive faces were presented. These observations support the view that face-sensitive visual areas discriminate attractiveness implicitly and rapidly from the human face.
Keywords: FPVS; facial attractiveness perception.
© The Author(s) 2019. Published by Oxford University Press.
Figures
Similar articles
-
Effect of face-related task on rapid individual face discrimination.Neuropsychologia. 2019 Jun;129:236-245. doi: 10.1016/j.neuropsychologia.2019.04.002. Epub 2019 Apr 12. Neuropsychologia. 2019. PMID: 30986421
-
An objective index of individual face discrimination in the right occipito-temporal cortex by means of fast periodic oddball stimulation.Neuropsychologia. 2014 Jan;52:57-72. doi: 10.1016/j.neuropsychologia.2013.10.022. Epub 2013 Nov 4. Neuropsychologia. 2014. PMID: 24200921
-
The effect of parametric stimulus size variation on individual face discrimination indexed by fast periodic visual stimulation.BMC Neurosci. 2014 Jul 19;15:87. doi: 10.1186/1471-2202-15-87. BMC Neurosci. 2014. PMID: 25038784 Free PMC article.
-
Understanding individual face discrimination by means of fast periodic visual stimulation.Exp Brain Res. 2014 Jun;232(6):1599-621. doi: 10.1007/s00221-014-3934-9. Epub 2014 Apr 12. Exp Brain Res. 2014. PMID: 24728131 Review.
-
Understanding human individuation of unfamiliar faces with oddball fast periodic visual stimulation and electroencephalography.Eur J Neurosci. 2020 Nov;52(10):4283-4344. doi: 10.1111/ejn.14865. Epub 2020 Sep 30. Eur J Neurosci. 2020. PMID: 32542962 Review.
Cited by
-
Implicit responses to face trustworthiness measured with fast periodic visual stimulation.J Vis. 2020 Jul 1;20(7):29. doi: 10.1167/jov.20.7.29. J Vis. 2020. PMID: 32725173 Free PMC article.
-
Mate assessment based on physical characteristics: a review and reflection.Biol Rev Camb Philos Soc. 2025 Feb;100(1):113-130. doi: 10.1111/brv.13131. Epub 2024 Aug 22. Biol Rev Camb Philos Soc. 2025. PMID: 39175167 Free PMC article. Review.
-
Increased sensitivity to social hierarchy during social competition versus cooperation.Soc Cogn Affect Neurosci. 2024 Oct 7;19(1):nsae060. doi: 10.1093/scan/nsae060. Soc Cogn Affect Neurosci. 2024. PMID: 39252588 Free PMC article.
-
An objective and reliable electrophysiological marker for implicit trustworthiness perception.Soc Cogn Affect Neurosci. 2020 May 19;15(3):337-346. doi: 10.1093/scan/nsaa043. Soc Cogn Affect Neurosci. 2020. PMID: 32280978 Free PMC article.
References
-
- Adrian E.D., Matthews B.H. (1934). The Berger rhythm: potential changes from the occipital lobes in man. Brain, 57(4), 355–85. - PubMed
-
- Aharon I., Etcoff N., Ariely D., Chabris C.F., O’Connor E., Breiter H.C. (2001). Beautiful faces have variable reward value: fMRI and behavioral evidence. Neuron, 32(3), 537–51. - PubMed
-
- Ales J.M., Norcia A.M. (2009). Assessing direction-specific adaptation using the steady-state visual evoked potential: results from EEG source imaging. Journal of Vision, 9(7), 8–8. - PubMed
-
- Alley T.R. (1988). Physiognomy and social perception In: Social and Applied Aspects of Perceiving Faces, pp. 167–86.
Publication types
MeSH terms
LinkOut - more resources
Full Text Sources
Molecular Biology Databases
