

Predicting Renal Cancer Recurrence: Defining Limitations of Existing Prognostic Models With Prospective Trial-Based Validation
- PMID: 31216227
- PMCID: PMC7085167
- DOI: 10.1200/JCO.19.00107
Predicting Renal Cancer Recurrence: Defining Limitations of Existing Prognostic Models With Prospective Trial-Based Validation
Abstract
Purpose: To validate currently used recurrence prediction models for renal cell carcinoma (RCC) by using prospective data from the ASSURE (ECOG-ACRIN E2805; Adjuvant Sorafenib or Sunitinib for Unfavorable Renal Carcinoma) adjuvant trial.
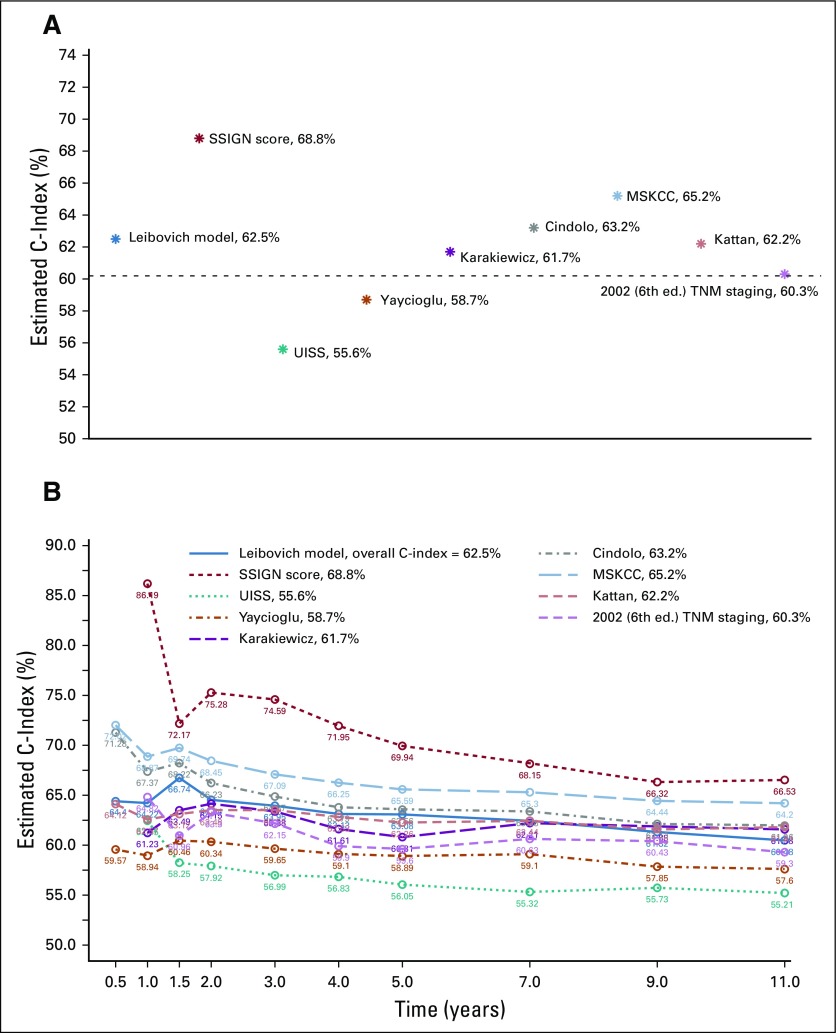
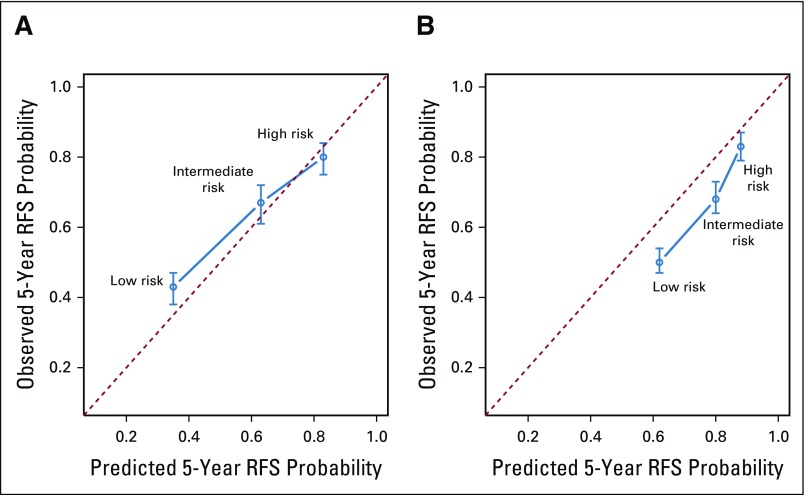
Patients and methods: Eight RCC recurrence models (University of California at Los Angeles Integrated Staging System [UISS]; Stage, Size, Grade, and Necrosis [SSIGN]; Leibovich; Kattan; Memorial Sloan Kettering Cancer Center [MSKCC]; Yaycioglu; Karakiewicz; and Cindolo) were selected on the basis of their use in clinical practice and clinical trial designs. These models along with the TNM staging system were validated using 1,647 patients with resected localized high-grade or locally advanced disease (≥ pT1b grade 3 and 4/pTanyN1Mo) from the ASSURE cohort. The predictive performance of the model was quantified by assessing its discriminatory and calibration abilities.
Results: Prospective validation of predictive and prognostic models for localized RCC showed a substantial decrease in each of the predictive abilities of the model compared with their original and externally validated discriminatory estimates. Among the models, the SSIGN score performed best (0.688; 95% CI, 0.686 to 0.689), and the UISS model performed worst (0.556; 95% CI, 0.555 to 0.557). Compared with the 2002 TNM staging system (C-index, 0.60), most models only marginally outperformed standard staging. Importantly, all models, including TNM, demonstrated statistically significant variability in their predictive ability over time and were most useful within the first 2 years after diagnosis.
Conclusion: In RCC, as in many other solid malignancies, clinicians rely on retrospective prediction tools to guide patient care and clinical trial selection and largely overestimate their predictive abilities. We used prospective collected adjuvant trial data to validate existing RCC prediction models and demonstrate a sharp decrease in the predictive ability of all models compared with their previous retrospective validations. Accordingly, we recommend prospective validation of any predictive model before implementing it into clinical practice and clinical trial design.
Conflict of interest statement
The content is solely the responsibility of the authors and does not necessarily represent the official views of the National Institutes of Health, nor does mention of trade names, commercial products, or organizations imply endorsement by the U.S. government.
Figures
References
-
- Denoix PF. [Nomenclature and classification of cancers based on an atlas] [Article in Undetermined Language] Acta Unio Int Contra Cancrum. 1953;9:769–771. - PubMed
-
- Amin MB, Greene FL, Edge SB, et al. The Eighth Edition AJCC Cancer Staging Manual: Continuing to build a bridge from a population-based to a more “personalized” approach to cancer staging. CA Cancer J Clin. 2017;67:93–99. - PubMed
-
- Kattan MW, Reuter V, Motzer RJ, et al. A postoperative prognostic nomogram for renal cell carcinoma. J Urol. 2001;166:63–67. - PubMed
-
- Sorbellini M, Kattan MW, Snyder ME, et al. A postoperative prognostic nomogram predicting recurrence for patients with conventional clear cell renal cell carcinoma. J Urol. 2005;173:48–51. - PubMed
-
- Zisman A, Pantuck AJ, Wieder J, et al. Risk group assessment and clinical outcome algorithm to predict the natural history of patients with surgically resected renal cell carcinoma. J Clin Oncol. 2002;20:4559–4566. - PubMed
