. 2019 Aug 1;30(17):2331-2347.
doi: 10.1091/mbc.E18-11-0722. Epub 2019 Jun 19.

Combinatorial diversity of Syk recruitment driven by its multivalent engagement with FcεRIγ

Affiliations

Combinatorial diversity of Syk recruitment driven by its multivalent engagement with FcεRIγ

Timothy Travers et al. Mol Biol Cell. .

Abstract

Syk/Zap70 family kinases are essential for signaling via multichain immune-recognition receptors such as tetrameric (αβγ2) FcεRI. Syk activation is generally attributed to cis binding of its tandem SH2 domains to dual phosphotyrosines within FcεRIγ-ITAMs (immunoreceptor tyrosine-based activation motifs). However, the mechanistic details of Syk docking on γ homodimers are unresolved. Here, we estimate that multivalent interactions for WT Syk improve cis-oriented binding by three orders of magnitude. We applied molecular dynamics (MD), hybrid MD/worm-like chain polymer modeling, and live cell imaging to evaluate relative binding and signaling output for all possible cis and trans Syk-FcεRIγ configurations. Syk binding is likely modulated during signaling by autophosphorylation on Y130 in interdomain A, since a Y130E phosphomimetic form of Syk is predicted to lead to reduced helicity of interdomain A and alter Syk's bias for cis binding. Experiments in reconstituted γ-KO cells, whose γ subunits are linked by disulfide bonds, as well as in cells expressing monomeric ITAM or hemITAM γ-chimeras, support model predictions that short distances between γ ITAM pairs are required for trans docking. We propose that the full range of docking configurations improves signaling efficiency by expanding the combinatorial possibilities for Syk recruitment, particularly under conditions of incomplete ITAM phosphorylation.


Figures
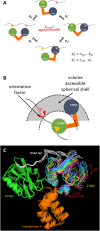
FIGURE 1:
FIGURE 1:
Structure-based analytical model for multivalent binding of Syk tandem SH2 domains to a single FcεRIγ chain. (A) Reaction network from unbound (left) to dual-bound (right) Syk. N-SH2, C-SH2, and interdomain A of Syk are shown in green, blue, and orange, respectively. The unstructured cytoplasmic region of the γ chain is shown as a wavy gray line, with pY64 and pY75 as pink and yellow symbols, respectively. (B) Schematic showing the accessible spherical shell where unbound SH2 can search for unbound ITAM and the orientation factor representing the flexibility of the γ chain, given prior binding of the other SH2:pTyr pair. Syk and the γ chain are colored as in A. (C) The six complexes in the asymmetric unit of the crystal structure of Syk tandem SH2 domains bound to CD3ε (PDB 1A81; Fütterer et al., 1998) were structurally aligned at the N-terminal SH2 (green cartoons). The translational (2 Å) and orientational (18°) variability range for C-terminal SH2 (magenta to blue cartoons) among these six aligned complexes are shown with red arrows.
FIGURE 2:
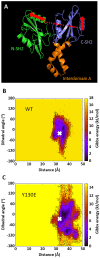
FIGURE 2:
Unbiased MD simulations show higher inter-SH2 flexibility in the Y130E phosphomimetic form of Syk. (A) Distance (red dashed line) and dihedral (across red arrows) reaction coordinates for describing the inter-SH2 positions and orientations. (B) Free energy surface map for the WT Syk simulations based on the two reaction coordinates. (C) Corresponding free energy surface map for the Y130E phosphomimetic Syk. The white X in B and C gives the position of the starting conformation for the MD simulations. Data were collected from seven replicates per construct, with 2 µs simulation time per replicate.
FIGURE 3:
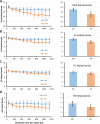
FIGURE 3:
REMD simulations show more helical unfolding of interdomain A in the Y130E phosphomimetic mutant. Time profiles over the entire trajectory (left) and cumulative bar plots of the last 500 ns (right) for the number of helical bonds from REMD simulations of WT (blue) and Y130E mutant (orange) interdomain A. Helical bond counts were done for (A) total helices, (B) helix 1 (H1), (C) helix 2 (H2), or (D) helix 3 (H3). Error bars give SEM.
FIGURE 4:
FIGURE 4:
Distance distributions between tandem SH2 domains from REMD-based models and between ITAM pTyrs from WLC models. (A) Distribution between SH2 domains from REMD-based models of WT tandem SH2. (B) Distribution between SH2 domains from REMD-based models of Y130E mutant tandem SH2. (C) The WT Syk distribution from A is shown with the distribution between ITAM pTyrs from the WLC model of a single FcεRIγ chain for cis binding (gray curve). (D) The Y130E Syk distribution from B is shown with the distribution between ITAM pTyrs from the WLC model of a single FcεRIγ chain for cis binding (gray curve). (E) The WT Syk distribution from A is shown with the distribution between ITAM pTyrs from WLC model of two FcεRIγ chains for trans binding (gray curve). (F) The Y130E Syk distribution from B is shown with the distribution between ITAM pTyrs from WLC model of two FcεRIγ chains for trans binding (gray curve). In C–F, the product of both distance distributions is shown by the red curve, whose integrated area gives Ceff. The magnitudes of the red curves have been increased here 100× to facilitate their visualization and comparison.
FIGURE 5:
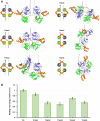
FIGURE 5:
WT tandem SH2 domains show higher affinity for cis binding in complex models of Syk–FcεRI with 2:2 binding stoichiometry. (A) Diagrams and corresponding atomistic structures of one cis and five trans binding modes that are physically viable and consistent with a 2:2 binding stoichiometry. Syk is depicted here using cartoons for N-SH2 (green), C-SH2 (blue), and interdomain A (orange). In each model, the two γ chains are colored differently (black and light pink), and how pY64 (pink) and pY75 (yellow) are bound is shown. Portions of the linker that connect the N-terminal end of the ITAM to the γ-chain transmembrane helices are shown for each model using artificial extended conformations, to give a sense of how each model may be oriented relative to the surface of the cytoplasmic leaflet of the cell membrane. (B) Unbiased MD simulations of these models in solution were then performed, with the artificial linker regions that connect the ITAMs to the transmembrane helices removed. The overall binding free energies were then calculated using the linear interaction energy (LIE) method (Aqvist et al., 1994) and are plotted here relative to the cis binding free energy. Error bars give SEM.
FIGURE 6:
FIGURE 6:
Additional contacts contribute to further stabilization of the cis binding mode. (A) Illustration showing that in the binding of the Syk N-SH2 domain to pY75 and the C-SH2 domain to pY64, asymmetrical contacts between pY75 and C-SH2 are formed (red encircled region). This is not the case for pY64 and N-SH2. Key: N-SH2 (green), C-SH2 (blue), interdomain A (orange), γ chain (magenta). (B) Average interaction energies of these asymmetrical contacts when engaged in each of the different 2:2 binding modes. (C) Illustration of additional contacts between the pTyrs bound to the Syk molecule on the right with the “bystander” Syk molecule on the left (red circles) for the cis orientation of the 2:2 Syk–FcεRIγ complex. Proteins are colored as in A. (D) Average interaction energies of these additional contacts, illustrating that these are significant only in the cis orientation. Error bars give SEM.
FIGURE 7:
FIGURE 7:
Calcium imaging of transiently FcεRIγ-reconstituted RBL-2H3 FcεRIγ-KO cells after antigen cross-linking supports the concept of trans docking of Syk onto pairs of monophosphorylated ITAMs, but with a greatly diminished response compared with that for cis docking. (A) RBL-2H3 FcεRIγ-KO were antigen cross-linked with DNP25-BSA (0.1 μg/ml) calcium imaged after FcεRIγ reconstitution with (top to bottom) WT, Y64A, Y75A, a combination of Y64A and Y75A single mutants, or the double mutant Y64A\Y75A. (B) The respective percentages of response after antigen cross-linking. Error bars indicate the 95% CI. (C) The time between antigen cross-linking and calcium release. (D) The relative increase in the Fura-2 ratio per cell after antigen cross-linking. SEM and mean are reported in C and D by error bars and crosses, respectively. ** P < 0.001, * P < 0.01 by the Fisher test and the two-sample Kolmogorov–Smirnov test. Experiments were conducted over a period of 5 d.
FIGURE 8:
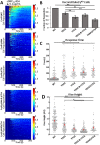
FIGURE 8:
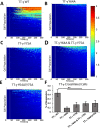
Calcium imaging after cross-linking of chimeric TTγ receptors demonstrates that Syk can bind in cis to a single ITAM but requires sufficiently close ITAMs for trans binding. Data are reported for RBL-2H3 cells transiently expressing (A) TT-FcεRIγ(WT), (B) TT-FcεRIγ(Y64A), (C) TT-FcεRIγ(Y75A), (D) the combination of TT-FcεRIγ(Y64A) and TT-FcεRIγ(Y75A), or (E) TT-FcεRIγ(Y64A\Y75A). Cells were preincubated for 10 min with Alexa647-labeled anti-Tac murine monoclonal antibodies and then cross-linked with anti-mouse secondary antibodies, as described in Materials and Methods. Heat maps indicate Ca2+ mobilization, with red indicating a strong response and blue indicating no release. (F) The respective percentages of response after TT cross-linking. Error bars indicate the 95% CI. ** P < 0.001 by the Fisher test. Experiments were conducted over a period of 5 d.

Similar articles

Cited by

References

    1. Abraham MJ, Murtola T, Schulz R, Páll S, Smith JC, Hess B, Lindahl E. (2015). GROMACS: high performance molecular simulations through multi-level parallelism from laptops to supercomputers. SoftwareX , 19–25.
    1. Aqvist J, Medina C, Samuelsson JE. (1994). A new method for predicting binding affinity in computer-aided drug design. Protein Eng , 385–391. - PubMed
    1. Åqvist J, Wennerström P, Nervall M, Bjelic S, Brandsdal BO. (2004). Molecular dynamics simulations of water and biomolecules with a Monte Carlo constant pressure algorithm. Chem Phys Lett , 288–294.
    1. Ardito F, Giuliani M, Perrone D, Troiano G, Lo Muzio L. (2017). The crucial role of protein phosphorylation in cell signaling and its use as targeted therapy (review). Int J Mol Med , 271–280. - PMC - PubMed
    1. Basson MA. (2012). Signaling in cell differentiation and morphogenesis. Cold Spring Harb Perspect Biol , a008151. - PMC - PubMed

Publication types