

RiboTag: Ribosomal Tagging Strategy to Analyze Cell-Type-Specific mRNA Expression In Vivo
- PMID: 31216392
- PMCID: PMC6615552
- DOI: 10.1002/cpns.77
RiboTag: Ribosomal Tagging Strategy to Analyze Cell-Type-Specific mRNA Expression In Vivo
Abstract
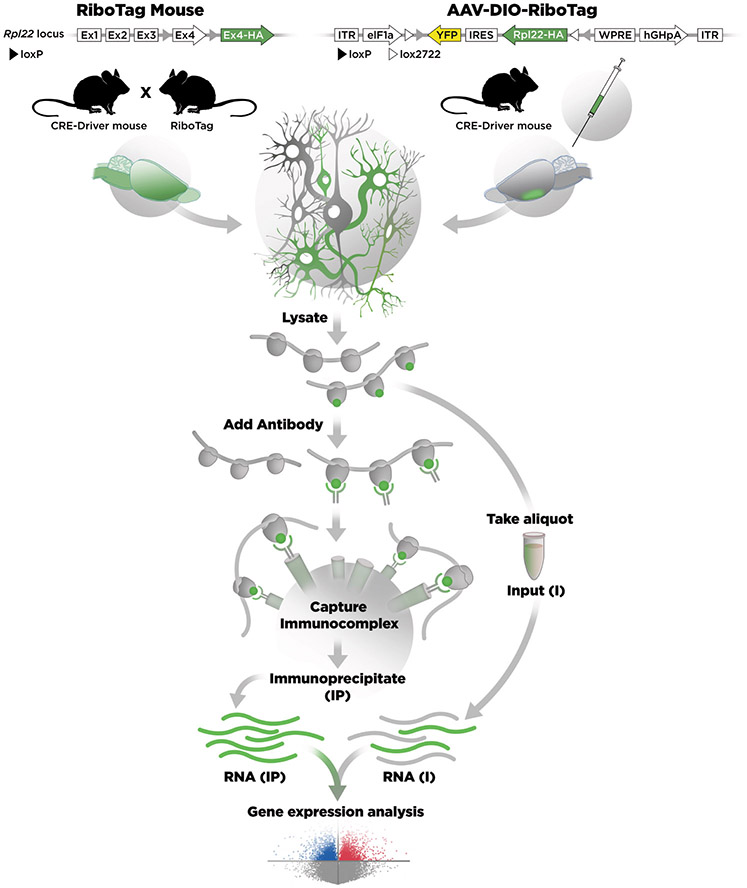
Ribosome tagging has become a very useful in vivo approach for analyzing gene expression and mRNA translation in specific cell types that are difficult and time consuming to isolate by conventional methods. The approach is based on selectively expressing a hemagglutinin A (HA)-tagged ribosomal protein in a target cell type and then using antibodies against HA to purify the polysomes and associated mRNAs from the target cell. The original approach makes use of a mouse line (RiboTag) harboring a modified allele of Rpl22 (Rpl22-HA) that is induced by the action of Cre recombinase. The Rpl22-HA gene can also be introduced into the animal by stereotaxic injection of an AAV-DIO-Rpl22-HA that is then activated in Cre-expressing cells. Both methods for tagging ribosomes facilitate the immunoprecipitation of ribosome-bound mRNAs and their analysis by qRT-PCR or RNA-Seq. This protocol will discuss the technical procedures and describe important considerations relevant to the analysis of the data. © 2019 by John Wiley & Sons, Inc.
Keywords: RNA-Seq; gene expression; neuron-specific mRNA; polyribosome immunoprecipitation; ribosome tagging.
© 2019 John Wiley & Sons, Inc.
Figures
References
-
- Boom R, Sol CJ, Salimans MM, Jansen CL, Wertheim-van Dillen PM, & van der Noordaa J (1990). Rapid and simple method for purification of nucleic acids. Journal of clinical microbiology, 28(3), 495–503. Retrieved from http://www.ncbi.nlm.nih.gov/pubmed/1691208. - PMC - PubMed
-
- Dafforn A, Chen P, Deng G, Herrler M, Iglehart D, Koritala S, . . . Kurn N (2004). Linear mRNA amplification from as little as 5 ng total RNA for global gene expression analysis. BioTechniques, 37(5), 854–857. Retrieved from http://www.ncbi.nlm.nih.gov/pubmed/15560142. doi:10.2144/04375PF01 - DOI - PubMed
-
- Dong HW (2019). Allen Mouse Brain Atlas. Retrieved from http://mouse.brain-map.org/static/atlas
-
- Gentleman R, Ihaka R, Bates D, Chambers J, Dalgaard P, Hornik K, . . . Murdoch D (2018). R (Version 3.5.1) [language and environment for statistical computing]: The R Foundation. Retrieved from https://www.r-project.org/
-
- Gore BB, Soden ME, & Zweifel LS (2013). Manipulating gene expression in projection-specific neuronal populations using combinatorial viral approaches. Curr Protoc Neurosci, 65, 4 35 31–20. Retrieved from https://www.ncbi.nlm.nih.gov/pubmed/25429312. doi:10.1002/0471142301.ns0435s65 - DOI - PMC - PubMed
Publication types
MeSH terms
Substances
Grants and funding
LinkOut - more resources
Full Text Sources
Other Literature Sources
