. 2019 Jun 18;27(12):3447-3459.e3.
doi: 10.1016/j.celrep.2019.05.072.

Dynamic Modulation of Cortical Excitability during Visual Active Sensing

Affiliations

Dynamic Modulation of Cortical Excitability during Visual Active Sensing

Annamaria Barczak et al. Cell Rep. .

Abstract

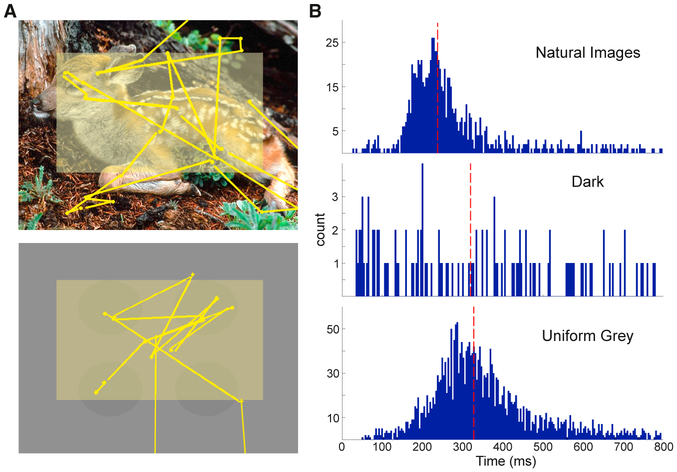
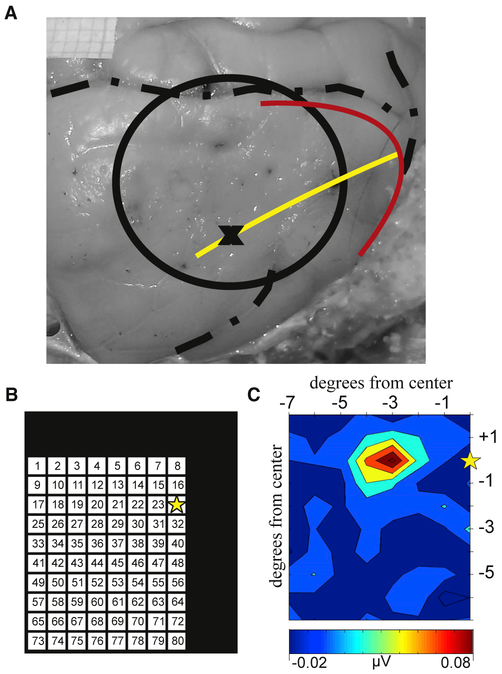
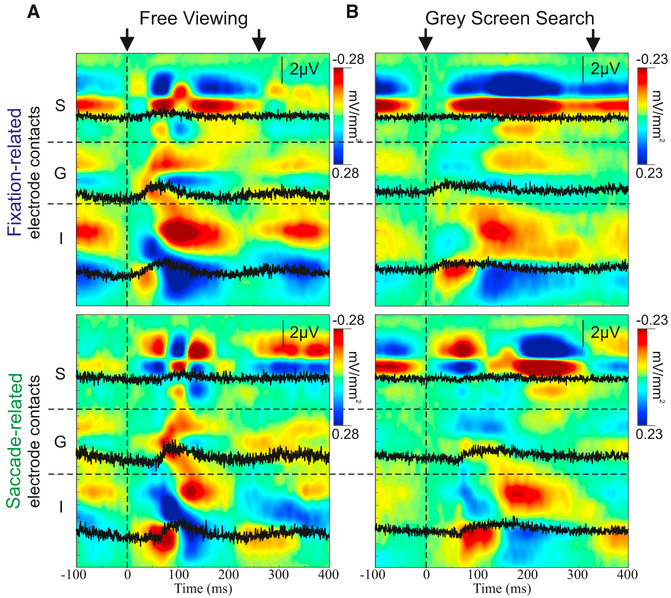
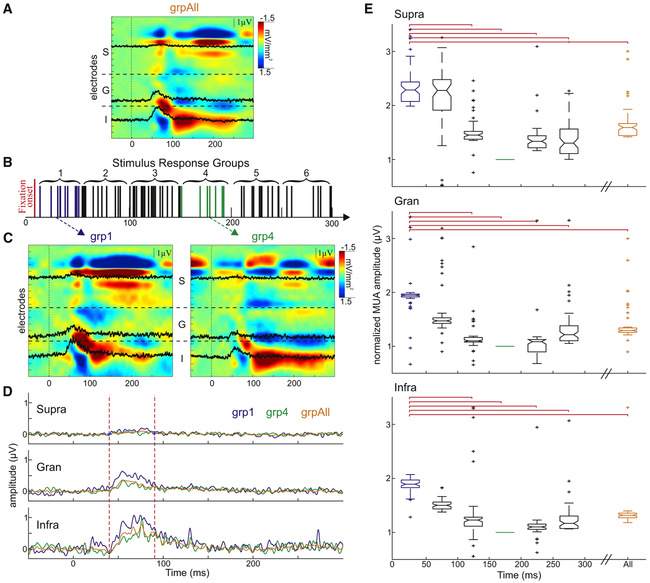
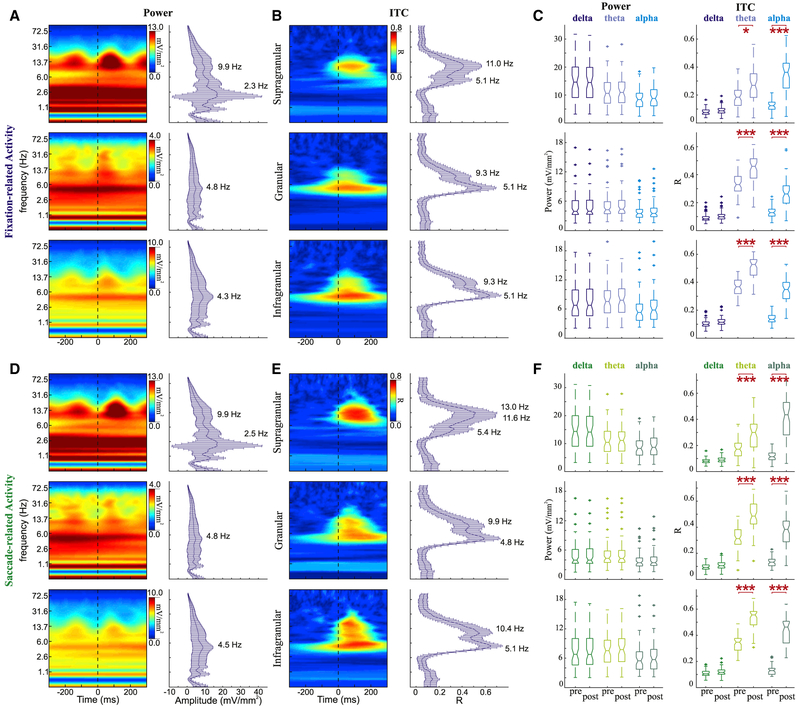
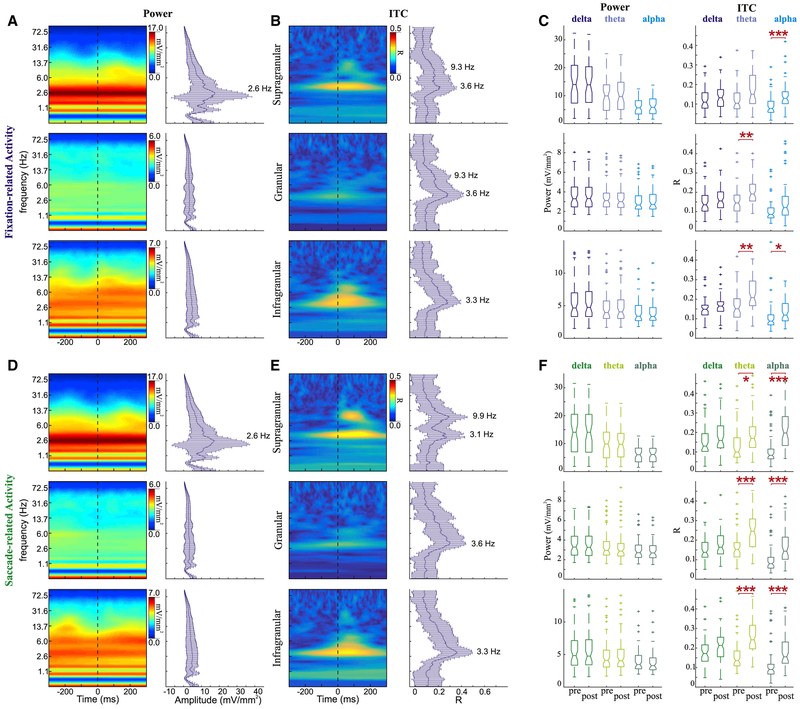
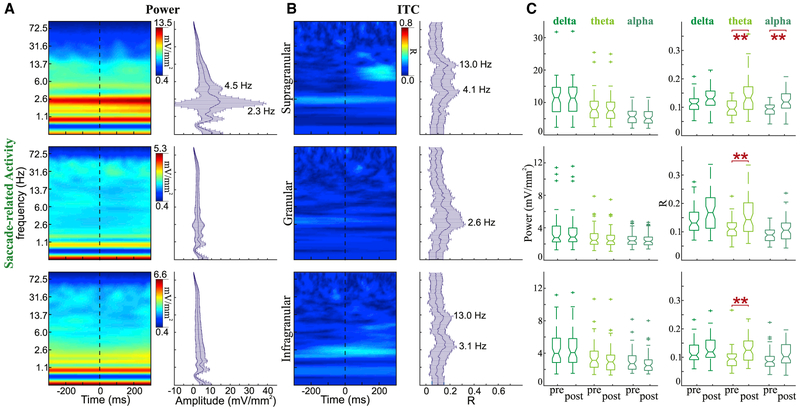
Visual physiology is traditionally investigated by presenting stimuli with gaze held constant. However, during active viewing of a scene, information is actively acquired using systematic patterns of fixations and saccades. Prior studies suggest that during such active viewing, both nonretinal, saccade-related signals and "extra-classical" receptive field inputs modulate visual processing. This study used a set of active viewing tasks that allowed us to compare visual responses with and without direct foveal input, thus isolating the contextual eye movement-related influences. Studying nonhuman primates, we find strong contextual modulation in primary visual cortex (V1): excitability and response amplification immediately after fixation onset, transiting to suppression leading up to the next saccade. Time-frequency decomposition suggests that this amplification and suppression cycle stems from a phase reset of ongoing neuronal oscillatory activity. The impact of saccade-related contextual modulation on stimulus processing makes active visual sensing fundamentally different from the more passive processes investigated in traditional paradigms.

Keywords: CSD; LFP; V1; active sensing; eye movements; local field potential; macaque; neuronal oscillations; saccadic modulation; vision.


Conflict of interest statement

DECLARATION OF INTERESTS

The authors declare no competing interests.

Figures

Figure 1.
Figure 1.. Eye Movement Dynamics across Tasks
(A) Sample screen images displayed during FV (top) and GSS (bottom) with representative scan patterns overlaid. Yellow dots and lines represent the locations of fixations and saccades, respectively. Faded yellow rectangle depicts the region of the screen where eye movements were analyzed. (B) Representative ISacI distributions during sample sessions of FV (top, n = 839), dark (center, n = 112), and GSS tasks (bottom, n = 2,441). Dashed vertical red lines depict the median ISacI of each representative distribution.
Figure 2.
Figure 2.. Receptive Field Mapping
(A) Photograph of the surface of the right occipital cortex. The circle indicates the chamber location. The red and yellow lines indicate the approximate location of the vertical and horizontal meridians, respectively. The black X is the approximate recording location for the receptive field example shown. (B) Location map for the receptive field paradigm. The black box depicts a portion of the screen display. The 8° × 10° matrix indicates locations where the 1° solid white circle flashes occurred while mapping the population receptive field at the electrode location, “X.” The yellow star indicates the center of the screen, where fixation was held. (C) Representative MUA map summarizing the receptive field for the neuronal population in the granular layer of the example recording site.
Figure 3.
Figure 3.. Representative Eye Movement-Related Laminar CSD Profiles
(A) CSD profiles (extracellular current sinks and sources in red and blue, respectively) aligned to fixation (top) and saccade onsets (bottom) for eye movements during the FV task. Three representative MUA channels within supragranular (S), granular (G), and infragranular (I) layers are overlaid in black. Black arrows at the top indicate the timing of the initial and approximate successive eye movements based on the median ISacI. (B) Similar to (A) for eye movements occurring during GSS.
Figure 4.
Figure 4.. Eye Movement-Related Transient Increase in Excitability
(A) Example laminar CSD profiles for pattern-evoked responses in grpAll aligned to stimulus onset with representative MUA channels overlaid in black. (B) Schematic depiction of the grouping of pattern-evoked responses according to the period of time between fixation and stimulus onset. (C) Example CSD response profiles for grp1 (left) and grp4 (right). Vertical lines at 0 ms denote stimulus onset. (D) Representative comparison between the average supragranular (top), granular (center), and infragranular (bottom) MUA responses to stimuli from grp1 (blue), grp4 (green), and grpAll (orange). Vertical dashed lines indicate time period used for statistical comparisons of the grouped data presented in (E). (E) Normalized, averaged pattern-evoked MUA amplitudes for all of the experiments across the supragranular (top), granular (center), and infragranular (bottom) layers for each of the seven stimulus response groups. Red brackets indicate significant difference between groups. For all layers: grp1 versus 2 p = NS, grp1 versus grp3 p < 0.001, grp1 versus grp4 p < 0.001, grp1 versus grp5 p < 0.001, and grp1 versus grp6 p < 0.001.
Figure 5.
Figure 5.. Spectrotemporal Profiles of Eye Movement Events during FV
(A) Example power spectra (left) for fixation-related activity aligned to fixation onset for supragranular (top), granular (center), and infragranular (bottom) layers. Frequency plots with error bars (right) show medians and SDs of power across all experiments (supra n = 52, gran and infra n = 58) at each frequency measured at the timing of the broadband power peak. (B) Example ITC profiles (left) for fixation-related activity aligned to fixation onset for supragranular (top), granular (center), and infragranular (bottom) layers. Frequency plots with error bars (right) show median ITC across all experiments at each frequency measured at the timing of the broadband power peak. (C) Boxplots statistically comparing power (left) and ITC (right) during the 200 ms period before and the 200 ms period after fixation onset. Horizontal red lines signify a significant difference pre-versus post-eye movement onset (Wilcoxon rank-sum tests with Bonferroni correction, *p < 0.05, **p < 0.01, and ***p < 0.001). (D–F) Saccade-related activity described with the same conventions as in (A) for power profiles (D), as in (B) for ITC profiles (E), and as in (C) for statistical comparisons across experiments (F).
Figure 6.
Figure 6.. Spectrotemporal Profiles of Eye Movement Events during GSS
(A) Example power spectra (left) for fixation-related activity aligned to fixation onset for supragranular (top), granular (middle), and infragranular (bottom) layers. Frequency plots with error bars (right) show median and SD of power across all experiments (supra n = 55; gran and infra n = 60) at each frequency measured at the timing of the broadband power peak. (B) Example ITC profiles (left) for fixation-related activity aligned to fixation onset for supragranular (top), granular (middle), and infragranular (bottom) layers. Frequency plots with error bars (right) show median ITC across all experiments at each frequency measured at the timing of the broadband power peak. (C) Boxplots statistically comparing power (left) and ITC (right) during the 200 ms period before and 200 ms period after fixation onset. Horizontal red lines signify a significant difference pre- vs post-eye movement onset (Wilcoxon rank-sum tests with Bonferroni correction, *p < 0.05, **p < 0.01, ***p < 0.001). (D–F) Saccade-related activity described with the same conventions as in (A) for power profiles (D), as in (B) for ITC profiles (E), and as in (C) for statistical comparisons across experiments (F).
Figure 7.
Figure 7.. Spectrotemporal Profiles of Saccades Made in the Dark
(A) Example power spectra (left) for saccade-related activity aligned to saccade onset for supragranular (top), granular (middle), and infragranular (bottom) layers. Frequency plots with error bars (right) show median and SD of power across all experiments (supra n = 49; gran and infra n = 56) at each frequency measured at the timing of the broadband power peak. (B) Saccade-related ITC activity described with the same conventions as in (A) for ITC profiles. (C) Boxplots statistically comparing power (left) and ITC (right) during the 300 ms period before and 300 ms period after fixation onset. Horizontal red lines signify a significant difference pre- versus post-saccade onset (Wilcoxon rank-sum tests with Bonferroni correction, *p < 0.05, **p < 0.01, and ***p < 0.001).

References

    1. Bastos AM, Loonis R, Kornblith S, Lundqvist M, and Miller EK (2018). Laminar recordings in frontal cortex suggest distinct layers for maintenance and control of working memory. Proc. Nat. Acad. Sci. U.S.A 115,1117–1122. - PMC - PubMed
    1. Bosman CA, Womelsdorf T, Desimone R, and Fries P (2009). A microsaccadic rhythm modulates gamma-band synchronization and behavior. J. Neurosci 29, 9471–9480. - PMC - PubMed
    1. Bremmer F, Kubischik M, Hoffmann KP, and Krekelberg B (2009). Neural dynamics of saccadic suppression. J. Neurosci 29, 12374–12383. - PMC - PubMed
    1. Burr DC, Morrone MC, and Ross J (1994). Selective suppression of the magnocellular visual pathway during saccadic eye movements. Nature 371, 511–513. - PubMed
    1. Carracedo LM, Kjeldsen H, Cunnington L, Jenkins A, Schofield I, Cunningham MO, Davies CH, Traub RD, and Whittington MA (2013). A neocortical delta rhythm facilitates reciprocal interlaminar interactions via nested theta rhythms. J. Neurosci 33, 10750–10761. - PMC - PubMed

Publication types

LinkOut - more resources