. 2019 Jun 18;27(12):3709-3723.e5.
doi: 10.1016/j.celrep.2019.05.077.

Modeling of Fibrotic Lung Disease Using 3D Organoids Derived from Human Pluripotent Stem Cells

Affiliations

Modeling of Fibrotic Lung Disease Using 3D Organoids Derived from Human Pluripotent Stem Cells

Alexandros Strikoudis et al. Cell Rep. .

Abstract

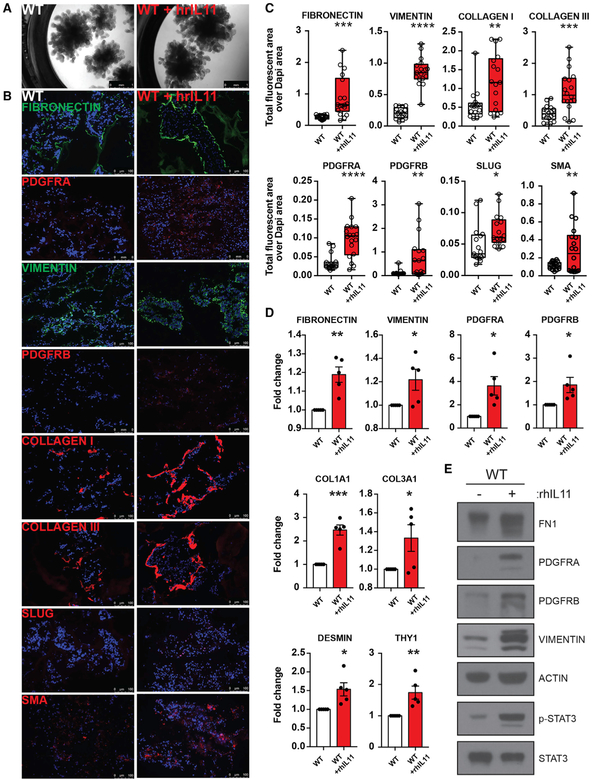
The pathogenesis of idiopathic pulmonary fibrosis (IPF), an intractable interstitial lung disease, is unclear. Recessive mutations in some genes implicated in Hermansky-Pudlak syndrome (HPS) cause HPS-associated interstitial pneumonia (HPSIP), a clinical entity that is similar to IPF. We previously reported that HPS1-/- embryonic stem cell-derived 3D lung organoids showed fibrotic changes. Here, we show that the introduction of all HPS mutations associated with HPSIP promotes fibrotic changes in lung organoids, while the deletion of HPS8, which is not associated with HPSIP, does not. Genome-wide expression analysis revealed the upregulation of interleukin-11 (IL-11) in epithelial cells from HPS mutant fibrotic organoids. IL-11 was detected predominantly in type 2 alveolar epithelial cells in end-stage IPF, but was expressed more broadly in HPSIP. Finally, IL-11 induced fibrosis in WT organoids, while its deletion prevented fibrosis in HPS4-/- organoids, suggesting IL-11 as a therapeutic target. hPSC-derived 3D lung organoids are, therefore, a valuable resource to model fibrotic lung disease.

Keywords: Hermansky-Pudlak syndrome; disease modeling; human pluripotent stem cells; interleukin-11; lung; organoids; pulmonary fibrosis.


Conflict of interest statement

DECLARATION OF INTERESTS

The authors declare no competing interests.

Figures

Figure 1.
Figure 1.. Generation 3D Lung Organoids Harboring Hermansky-Pudlak Syndrome (HPS)-Associated Mutations
(A) Bright-field images of day 40 Matrigel-embedded 3D lung organoid cultures generated from parental wild-type (WT) ESCs or from ESC with CRISPR/Cas9-induced mutations in HPS genes. Protein complexes affected by each mutation are indicated at top. Scale bar: 1 mm (representative of n = 3 independent experiments).(B) Immunofluorescence (IF) analysis of day 40 Matrigel-embedded 3D lung organoids generated from parental WT ESCs or from ESC with CRISPR/Cas9-induced mutations in HPS genes. Red and green: corresponding IF markers indicated for each stain. Blue: DAPI stain. Scale bar: 100 mm (representative of n = 3 independent experiments).
Figure 2.
Figure 2.. Characterization of HPS Mutant Lung Organoids
(A) Fluorescent area over DAPI area for indicated ECM and mesenchymal markers in cryosections of day 40 organoids. Boxplot lines indicate medians; whiskers represent minimum and maximum of all data. n = 18 independent images from n = 3 independent experiments. Unpaired two-tailed Student’s t test. n.s., non-significant (p > 0.05). *p % 0.05, **p % 0.01, ***p % 0.001, and ****p % 0.0001. Error bars indicate mean ± SEM. (B) Western blot analysis for ECM and mesenchymal markers of day 40 WT or HPS mutant organoids. (C) Trichrome staining of WT and HPS1−/− organoids. (D) Expression by qRT-PCR of mRNA for ECM and mesenchymal markers relative to WT control. n = 5 independent experiments. Unpaired two-tailed Student’s t test. n.s., non-significant (p > 0.05). *p % 0.05, **p % 0.01, ***p % 0.001, and ****p % 0.0001. Error bars indicate mean ± SEM. (E) Frequency of epithelial (EPCAM+THY1−) and mesenchymal (EPCAMTHY1+) as measured by flow cytometry. n = 3. Unpaired two-tailed Student’s t test. n.s., non-significant (p > 0.05). *p % 0.05 and **p % 0.01. Error bars indicate mean ± SEM.
Figure 3.
Figure 3.. Genome-wide Expression Analysis of HPS Mutant Day 40 Lung Organoids
(A) Comparison of genome-wide expression in EPCAM+ fluorescence-activated cell sorting (FACS)-sorted epithelial cells from day 40 WT and HPS mutant organoids with the KeyGenes database, showing matching with second-trimester human lung. Each group corresponds to three individual biological replicates. (B) Venn diagrams indicating significant differentially upregulated or downregulated genes, respectively, following gene expression analysis of each group of HPS mutations compared to WT control. (C) Heatmap representation of significant differentially expressed genes extracted from RNA-seq genome-wide expression analysis of EPCAM+ epithelial cells from HPS mutant and WT control organoids. Each group represents the mean of three individual biological replicates. (D) Volcano plot showing log2 fold-change and −log10 of p value for each individual gene in epithelial cells with HPS1 mutation compared to WT control. Red: significant genes with a false-discovery rate (FDR) < 0.05. Gray: non-significant genes. Black: common HPS1 and HPS2 significant genes compared to WT control. (E) Gene Ontology analysis of common HPS1 and HPS2 significant genes compared to WT control using DAVID.
Figure 4.
Figure 4.. Expression of IL-11 in HPSIP and IPF
Representative images (from 3 HPSIP and 2 IPF patients) of expression of EPCAM, SFTPC and IL11 in explanted lungs from end-stage patients pre-transplantation as measured by in situ hybridization. The corresponding H&E stains are shown on the left (scale bar: 100 mM).
Figure 5.
Figure 5.. Effect of IL-11 on Fibrosis in WT Day 40 Lung Organoids
(A) Bright-field images of day 40 WT lung organoids cultured in the presence or absence of recombinant human IL-11 (rhIL-11) from day 25. Scale bar: 1 mm. (B) IF images from cryosection stains from day 40 WT lung organoids cultured in the presence or absence of rhIL-11. Red and green: corresponding IF markers indicated for each stain. Blue: DAPI stain. Scale bar: 100 mm. (C) Fluorescent area over DAPI area for indicated ECM and mesenchymal markers in cryosections of day 40 WT organoids cultured in the presence or absence or rhIL-11. Boxplot lines indicate medians; whiskers represent minimum and maximum of all data. n = 18 independent images from n = 3 independent experiments. Unpaired two-tailed Student’s t test. *p % 0.05, **p % 0.01, ***p % 0.001, and ****p % 0.0001. Error bars indicate mean ± SEM.
Figure 6.
Figure 6.. Effect of IL-11 on Fibrosis in WT Day 40 Lung Organoids Compared to HPS Mutant Organoids
IF images from cryosection stains from day 40 WT lung organoids cultured in the presence or absence or rhIL-11, as well as HPS1−/−, HPS2−/−, HPS4−/−, and HPS8−/− organoids. Red and green: corresponding IF markers indicated for each stain. Blue: DAPI stain. Scale bar: 100 μm.
Figure 7.
Figure 7.. Characterization of HPS4−/− IL11−/− Lung Organoids
(A) Bright-field images of HPS4−/− day 40 lung organoids compared to organoids generated from HPS4−/− IL11−/− ESCs. Scale bar: 1 mm. (B) IF images from cryosection stains from day 40 HPS4−/− and HPS4−/− IL11−/− lung organoids. Red and green: corresponding IF markers indicated for each stain. Blue: DAPI stain. Scale bar: 100 mm. (C) Fluorescent area over DAPI area for indicated ECM and mesenchymal markers in cryosections of day 40 HPS4−/− and HPS4−/− IL11−/− lung organoids. Boxplot lines indicate medians; whiskers represent minimum and maximum of all data. n = 18 independent images from n = 3 independent experiments. Unpaired two-tailed Student’s t test. *p % 0.05, **p % 0.01, ***p % 0.001, and ****p % 0.0001. Error bars indicate mean ± SEM. (D) Expression by qRT-PCR of mRNA for ECM and mesenchymal markers in d40 HPS4−/− and HPS4−/− IL11−/− lung organoids, normalized to expression in HPS4−/− organoids. n = 5 independent experiments. Unpaired two-tailed Student’s t test. *p % 0.05, **p % 0.01, ***p % 0.001, and ****p % 0.0001. Error bars indicate mean ± SEM.

References

    1. Alder JK, Chen JJ, Lancaster L, Danoff S, Su SC, Cogan JD, Vulto I, Xie M, Qi X, Tuder RM, et al. (2008). Short telomeres are a risk factor for idiopathic pulmonary fibrosis. Proc. Natl. Acad. Sci. USA 105, 13051–13056. - PMC - PubMed
    1. Alder JK, Cogan JD, Brown AF, Anderson CJ, Lawson WE, Lansdorp PM, Phillips JA 3rd, Loyd JE, Chen JJ, and Armanios M (2011). Ancestral mutation in telomerase causes defects in repeat addition processivity and manifests as familial pulmonary fibrosis. PLoS Genet. 7, e1001352. - PMC - PubMed
    1. Alder JK, Stanley SE, Wagner CL, Hamilton M, Hanumanthu VS, and Armanios M (2015a). Exome sequencing identifies mutant TINF2 in a family with pulmonary fibrosis. Chest 147, 1361–1368. - PMC - PubMed
    1. Alder JK, Barkauskas CE, Limjunyawong N, Stanley SE, Kembou F, Tuder RM, Hogan BL, Mitzner W, and Armanios M (2015b). Telomere dysfunction causes alveolar stem cell failure. Proc. Natl. Acad. Sci. USA 112, 5099–5104. - PMC - PubMed
    1. American Thoracic Society; European Respiratory Society (2002). American Thoracic Society/European Respiratory Society International Multidisciplinary Consensus Classification of the Idiopathic Interstitial Pneumonias. This joint statement of the American Thoracic Society (ATS), and the European Respiratory Society (ERS) was adopted by the ATS board of directors, June 2001 and by the ERS Executive Committee, June 2001. Am. J. Respir. Crit. Care Med 165, 277–304. - PubMed

Publication types

MeSH terms