. 2019 Jun 18;19(12):2736.
doi: 10.3390/s19122736.

Exploration of Chlorophyll a Fluorescence and Plant Gas Exchange Parameters as Indicators of Drought Tolerance in Perennial Ryegrass

Affiliations

Exploration of Chlorophyll a Fluorescence and Plant Gas Exchange Parameters as Indicators of Drought Tolerance in Perennial Ryegrass

Piotr Dąbrowski et al. Sensors (Basel). .

Abstract

Perennial ryegrass (Lolium perenne L.) belongs to the common cultivated grass species in Central and Western Europe. Despite being considered to be susceptible to drought, it is frequently used for forming the turf in urban green areas. In such areas, the water deficit in soil is recognized as one of the most important environmental factors, which can limit plant growth. The basic aim of this work was to explore the mechanisms standing behind the changes in the photosynthetic apparatus performance of two perennial ryegrass turf varieties grown under drought stress using comprehensive in vivo chlorophyll fluorescence signal analyses and plant gas exchange measurements. Drought was applied after eight weeks of sowing by controlling the humidity of the roots ground medium at the levels of 30, 50, and 70% of the field water capacity. Measurements were carried out at four times: 0, 120, and 240 h after drought application and after recovery (refilling water to 70%). We found that the difference between the two tested varieties' response resulted from a particular re-reduction of P700+ (reaction certer of PSI) that was caused by slower electron donation from P680. The difference in the rate of electron flow from Photosystem II (PSII) to PSI was also detected. The application of the combined tools (plants' photosynthetic efficiency analysis and plant gas exchange measurements) allowed exploring and explaining the specific variety response to drought stress.

Keywords: MR 820; chlorophyll; delayed fluorescence; gas exchange; plant stress; turf grass varieties.


Conflict of interest statement

The authors declare no conflict of interest.

Figures

Figure A1
Figure A1
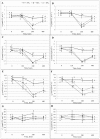
Differential curves of ΔWK (obtained by subtracting the control curve from the first sample in the time from 0.02 to 3 ms) of perennial ryegrass varieties (Roadrunner and Nira) under different field water capacity of soil (50 and 30% FWC) and time (0, 120, 240 and 400 h after stress application): (A) Roadrunner under 50% FWC, (B) Roadrunner under 30% FWC, (C) Nira under 50% FWC, (D) Nira under 30% FWC. n = 6. Relative units.
Figure A2
Figure A2
Differential curves of ΔWL (obtained by subtracting the control curve from the first sample in time from 0.02 to 0.3 ms) of perennial ryegrass varieties (Roadrunner and Nira) under different field water capacity of soil (50 and 30% FWC) and time (0, 120, 240 and 400 h after stress application): (A) Roadrunner under 50% FWC, (B) Roadrunner under 30% FWC, (C) Nira under 50% FWC, (D) Nira under 30% FWC. n = 6. Relative units.
Figure A3
Figure A3
Differential curves of ΔWH (obtained by subtracting the control curve from the first sample time from 1.9 to 30 ms) of perennial ryegrass varieties (Roadrunner and Nira) under different field water capacity of soil (50 and 30% FWC) and time (0, 120, 240 and 400 h after stress application): (A) Roadrunner under 50% FWC, (B) Roadrunner under 30% FWC, (C) Nira under 50% FWC, (D) Nira under 30% FWC. n = 6. Relative units.
Figure A4
Figure A4
Differential curves of ΔWG (obtained by subtracting the control curve from the first sample in time from 30 to 1000 ms) of perennial ryegrass varieties (Roadrunner and Nira) under different field water capacity of soil (50 and 30% FWC) and time (0, 120, 240 and 400 h after stress application): (A) Roadrunner under 50% FWC, (B) Roadrunner under 30% FWC, (C) Nira under 50% FWC, (D) Nira under 30% FWC. n = 6. Relative units.
Figure 1
Figure 1
Induction curves of chlorophyll a fluorescence of perennial ryegrass varieties (Roadrunner and Nira) grown under different field water capacities of soil (50 and 30% field water content (FWC)) at 0, 120, 240, and 400 h after stress application. (A) Roadrunner under 50% FWC, (B) Roadrunner under 30% FWC, (C) Nira under 50% FWC, (D) Nira under 30% FWC. n = 6 relative units. rel. u., relative units.
Figure 2
Figure 2
Differential curves of ΔVt (obtained by subtracting the control curve from the first sample) of perennial ryegrass varieties (Roadrunner and Nira) under different field water capacities of soil (50 and 30% FWC) and times (0, 120, 240, and 400 h after stress application): (A) Roadrunner under 50% FWC, (B) Roadrunner under 30% FWC, (C) Nira under 50% FWC, (D) Nira under 30% FWC. n = 6 relative units.
Figure 3
Figure 3
JIP-test parameters normalized to the values before stress application (0 h) as radar plots under different field water capacities of soil (50 and 30% FWC). (A) Roadrunner under 50% FWC, (B) Roadrunner under 30% FWC, (C) Nira under 50% FWC, (D) Nira under 30% FWC. Relative units. Means of one parameter marked by an asterisk differ significantly (p < 0.05, n = 6).
Figure 4
Figure 4
Delayed fluorescence induction curves of perennial ryegrass varieties (Roadrunner and Nira) under different field water capacities of soil (50 and 30% FWC) and times (0, 120, 240, and 400 h after stress application): (A) Roadrunner under 50% FWC, (B) Roadrunner under 30% FWC, (C) Nira under 50% FWC, (D) Nira under 30% FWC. n = 6. Relative units.
Figure 5
Figure 5
(I1-D2)/D2 and I1/I2 ratios ± S.D. of perennial ryegrass varieties (Roadrunner and Nira) under different field water capacities of soil (50 and 30% FWC) and times (0, 120, 240, and 400 h after stress application): (A) Roadrunner under 50% FWC, (B) Roadrunner under 30% FWC, (C) Nira under 50% FWC, (D) Nira under 30% FWC. n = 6. Relative units. Mean values within a term marked by the same letter did not show significant differences (p < 0.05, n = 6).
Figure 6
Figure 6
Kinetics of modulated light reflection at 820 nm (all data are normalized to the initial measured value of the signal) of perennial ryegrass varieties (Roadrunner and Nira) under different field water capacities of soil (50 and 30% FWC) and times (0, 120, 240, and 400 h after stress application): (A) Roadrunner under 50% FWC, (B) Roadrunner under 30% FWC, (C) Nira under 50% FWC, (D) Nira under 30% FWC. n = 6 relative units.
Figure 7
Figure 7
Relative rates of reaction centers of PS I (P700) oxidation (A,C) and P700+ re-reduction (B,D) ± S.D. calculated from the MR820 signal of Roadrunner (A,B) and Nira (C,D) under different field water capacities of soil (50 and 30% FWC) and times (0, 120, 240, and 400 h after stress application). Relative units. Mean values within a term marked by the same letter did not show significant differences (p < 0.05, n = 6).
Figure 8
Figure 8
Gas exchange parameters ± S.D. of Roadrunner and Nira under different field water capacities (70, 50, and 30% FWC) and times after the application of stress (0, 120, 240, and 400 h). (A) CO2 assimilation (A) in Roadrunner; (B) CO2 assimilation (A) in Nira; (C) H2O transpiration (E) in Roadrunner; (D) H2O transpiration (E) in Nira; (E) stomatal conductance (gs) in Roadrunner; (F) stomatal conductance (Gs) in Nira; (G) internal CO2 concentration (Ci) in Roadrunner; (H) internal CO2 concentration (Ci) in Nira. Mean values within a term marked by the same letter did not show significant differences (p < 0.05, n = 6).
Figure 9
Figure 9
Pearson correlation coefficients (r) between prompt fluorescence parameters and CO2 assimilation (A) (correlations significant at p < 0.05, n = 6). Relations between parameters marked by a solid line were calculated for plants in control conditions, and those marked by a dotted line were calculated for plants under 30% FWC.
Figure 10
Figure 10
Pearson correlation coefficients (r) between delayed fluorescence parameters and CO2 assimilation (A) and between modulated reflection at 820 nm and CO2 assimilation (A) (correlations significant at p < 0.05, n = 6). Relations between parameters marked by a solid line were calculated for plants in control conditions, and those marked by a dotted line were calculated for plants under 30% FWC.

References

    1. Radziemska M., Gusiatin Z.M., Bilgin A.A. Potential of using immobilizing agents in aided phytostabilization on simulated contamination of soil with lead. Ecol. Eng. 2017;102:490–500. doi: 10.1016/j.ecoleng.2017.02.028. - DOI
    1. Radziemska M., Bilgin A., Vaverková M.D. Application of mineral–based amendments for enhancing phytostabilization in Lolium perenne L. cultivation. Clean-Soil Air Water. 2018;46 doi: 10.1002/clen.201600679. - DOI
    1. Bęś A., Warmiński K., Adomas B. Long-term responses of Scots pine (Pinus sylvestris L.) and European beech (Fagus sylvatica L.) to the contamination of light soils with diesel oil. Environ. Sci. Pollut. Res. 2019 doi: 10.1007/s11356-019-04328-6. in press. - DOI - PMC - PubMed
    1. Sung C.Y. Mitigating surface urban heat island by a tree protection policy: A case study of The Woodland, Texas, USA. Urban For. Urban Green. 2013;12:474–480. doi: 10.1016/j.ufug.2013.05.009. - DOI
    1. Hidalgo J., Masson V., Baklanov A., Pigeon G., Gimeno L. Advances in urbanclimate modeling. Ann. N. Y. Acad. Sci. 2008;1146:354–374. doi: 10.1196/annals.1446.015. - DOI - PubMed

LinkOut - more resources