. 2019 Jun 18;8(6):872.
doi: 10.3390/jcm8060872.

Supervised Machine Learning Based Multi-Task Artificial Intelligence Classification of Retinopathies

Affiliations

Supervised Machine Learning Based Multi-Task Artificial Intelligence Classification of Retinopathies

Minhaj Alam et al. J Clin Med. .

Abstract

Artificial intelligence (AI) classification holds promise as a novel and affordable screening tool for clinical management of ocular diseases. Rural and underserved areas, which suffer from lack of access to experienced ophthalmologists may particularly benefit from this technology. Quantitative optical coherence tomography angiography (OCTA) imaging provides excellent capability to identify subtle vascular distortions, which are useful for classifying retinovascular diseases. However, application of AI for differentiation and classification of multiple eye diseases is not yet established. In this study, we demonstrate supervised machine learning based multi-task OCTA classification. We sought 1) to differentiate normal from diseased ocular conditions, 2) to differentiate different ocular disease conditions from each other, and 3) to stage the severity of each ocular condition. Quantitative OCTA features, including blood vessel tortuosity (BVT), blood vascular caliber (BVC), vessel perimeter index (VPI), blood vessel density (BVD), foveal avascular zone (FAZ) area (FAZ-A), and FAZ contour irregularity (FAZ-CI) were fully automatically extracted from the OCTA images. A stepwise backward elimination approach was employed to identify sensitive OCTA features and optimal-feature-combinations for the multi-task classification. For proof-of-concept demonstration, diabetic retinopathy (DR) and sickle cell retinopathy (SCR) were used to validate the supervised machine leaning classifier. The presented AI classification methodology is applicable and can be readily extended to other ocular diseases, holding promise to enable a mass-screening platform for clinical deployment and telemedicine.

Keywords: artificial intelligence; computer aided diagnosis; diabetic retinopathy; ophthalmology; optical coherence tomography angiography; quantitative analysis; sickle cell retinopathy; support vector machine.


Conflict of interest statement

Pending patent application: X. Yao, M. Alam, and J. I. Lim. No other competing interest for any other authors.

Figures

Figure 1
Figure 1
(A) Step by step methodology of artificial intelligence (AI) based classification. (B) Optimal feature selection with hierarchical backward elimination technique. DA and FE: data acquisition and feature extraction; OFI: optimal feature identification; MTC: Multiple-task classification.
Figure 2
Figure 2
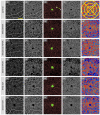
Representative optical coherence tomography angiography (OCTA) images for illustrating the feature extraction. (A1A5) Control subject, (B1B5) mild non-proliferative diabetic retinopathy (NPDR) subject, (C1C5) moderate NPDR subject, (D1D5) severe NPDR subject, (E1E5) mild sickle cell retinopathy (SCR) (stage II) subject, (F1F5) severe SCR subject. Column 1: OCTA image. Column 2: Segmented blood vessel map including large blood vessels and small capillaries. Hessian based Frangi vesselness filter and fractal dimension (FD) classification provide a robust and accurate blood vessel map. Column 3: Skeletonized blood vessel map (red) with segmented foveal avascular zone (FAZ) (marked green region) and FAZ contour (yellow boundary marked around FAZ). Column 4: Vessel perimeter map. Column 5: Contour maps created with normalized values of local fractal dimension. Scale bar shown in A1 corresponds to 1.5 mm and applies to all the images.
Figure 3
Figure 3
Normalized feature trends for different cohorts. (A) Change in disease group (DR and SCR) compared to control. (B) Change in SCR compared to DR. (C) Change in moderate and severe NPDR compared to mild NPDR. (D) Change in severe SCR compared to mild SCR. Error bars represent standard deviation.
Figure 4
Figure 4
ROC curves illustrating classification performances of the prediction model using optimal combination of features. (A) Control vs disease classification. (B) DR vs. SCR classification. (C) NPDR staging. (D) SCR staging.
Figure 5
Figure 5
Correlation analysis among four most sensitive features. The scatter plot also shows the distribution of control, DR and SCR patient data for different feature combination.

References

    1. Ting D.S., Liu Y., Burlina P., Xu X., Bressler N.M., Wong T.Y. AI for medical imaging goes deep. Nat. Med. 2018;24:539–540. doi: 10.1038/s41591-018-0029-3. - DOI - PubMed
    1. Ting D.S.W., Cheung C.Y.-L., Lim G., Tan G.S.W., Quang N.D., Gan A., Hamzah H., Garcia-Franco R., San Yeo I.Y., Lee S.Y., et al. Development and validation of a deep learning system for diabetic retinopathy and related eye diseases using retinal images from multiethnic populations with diabetes. JAMA. 2017;318:2211–2223. doi: 10.1001/jama.2017.18152. - DOI - PMC - PubMed
    1. Kermany D.S., Goldbaum M., Cai W., Valentim C.C., Liang H., Baxter S.L., McKeown A., Yang G., Wu X., Yan F. Identifying medical diagnoses and treatable diseases by image-based deep learning. Cell. 2018;172:1122–1131.e9. doi: 10.1016/j.cell.2018.02.010. - DOI - PubMed
    1. Burlina P.M., Joshi N., Pekala M., Pacheco K.D., Freund D.E., Bressler N.M. Automated grading of age-related macular degeneration from color fundus images using deep convolutional neural networks. JAMA Ophthalmol. 2017;135:1170–1176. doi: 10.1001/jamaophthalmol.2017.3782. - DOI - PMC - PubMed
    1. Alam M., Zhang Y., Lim J., Chan R.V.P., Yang M., Yao X. Quantitative Optical Coherence Tomography Angiography Features for Objective Classification and Staging of Diabetic Retinopathy. Retina. 2018 doi: 10.1097/IAE.0000000000002373. - DOI - PMC - PubMed