. 2019 Jun 19;11(1):91.
doi: 10.1186/s13148-019-0672-7.

DNA methylation signature of human hippocampus in Alzheimer's disease is linked to neurogenesis

Affiliations

DNA methylation signature of human hippocampus in Alzheimer's disease is linked to neurogenesis

Miren Altuna et al. Clin Epigenetics. .

Abstract

Background: Drawing the epigenome landscape of Alzheimer's disease (AD) still remains a challenge. To characterize the epigenetic molecular basis of the human hippocampus in AD, we profiled genome-wide DNA methylation levels in hippocampal samples from a cohort of pure AD patients and controls by using the Illumina 450K methylation arrays.

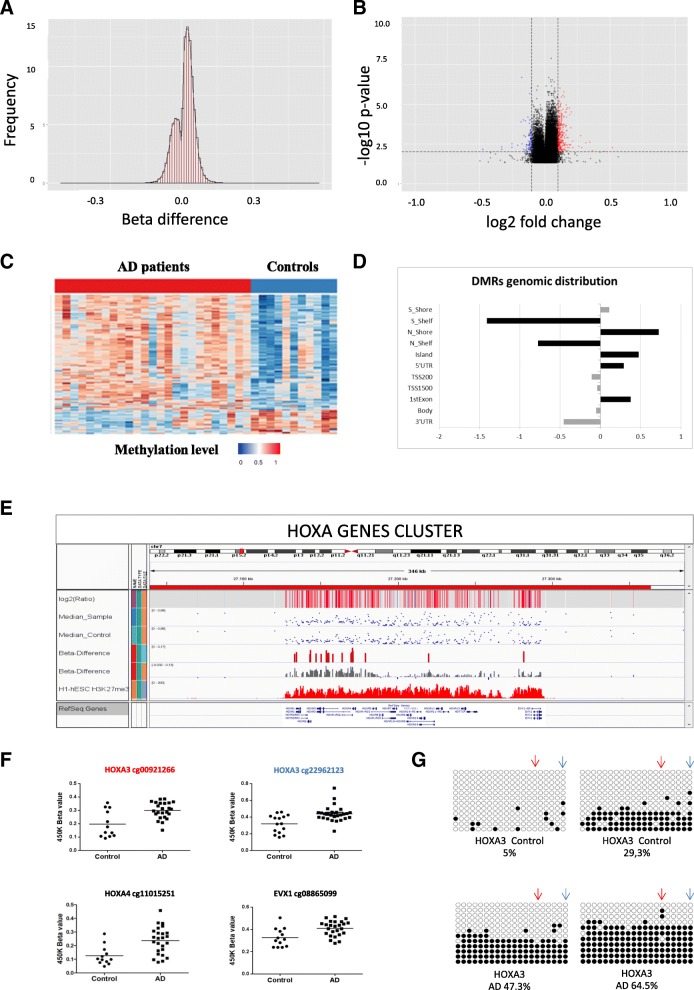
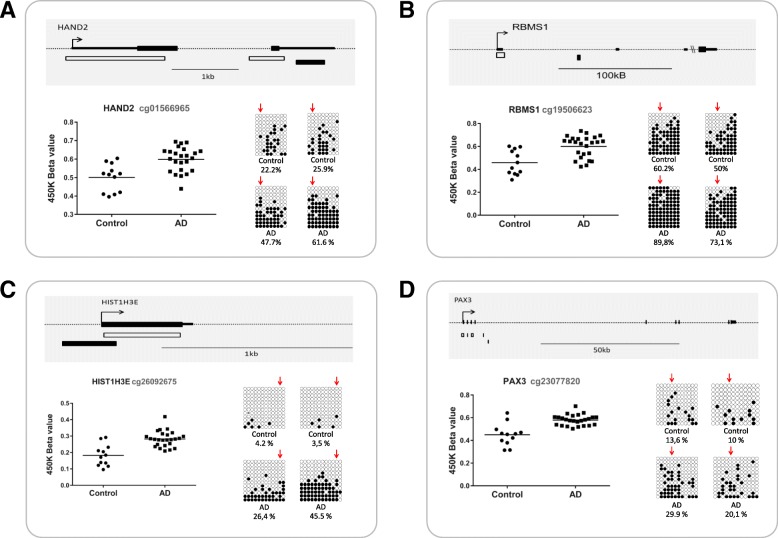
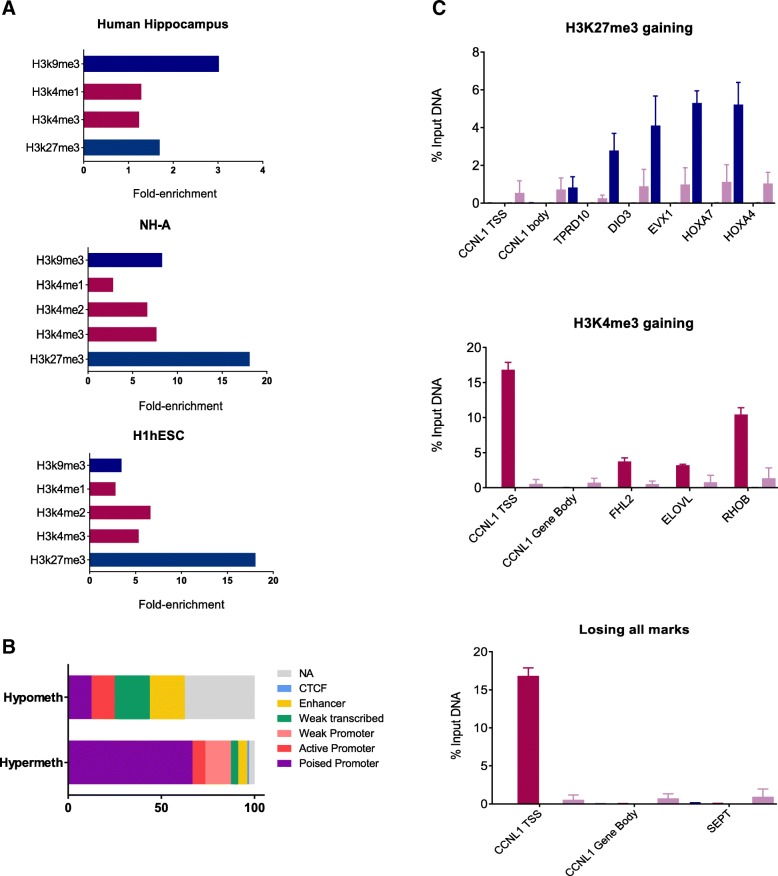
Results: Up to 118 AD-related differentially methylated positions (DMPs) were identified in the AD hippocampus, and extended mapping of specific regions was obtained by bisulfite cloning sequencing. AD-related DMPs were significantly correlated with phosphorylated tau burden. Functional analysis highlighted that AD-related DMPs were enriched in poised promoters that were not generally maintained in committed neural progenitor cells, as shown by ChiP-qPCR experiments. Interestingly, AD-related DMPs preferentially involved neurodevelopmental and neurogenesis-related genes. Finally, InterPro ontology analysis revealed enrichment in homeobox-containing transcription factors in the set of AD-related DMPs.

Conclusions: These results suggest that altered DNA methylation in the AD hippocampus occurs at specific regulatory regions crucial for neural differentiation supporting the notion that adult hippocampal neurogenesis may play a role in AD through epigenetic mechanisms.

Keywords: Adult neurogenesis; Alzheimer’s; DNA methylation; Epigenetics; Hippocampus; Homeobox; Neurodevelopment; Poised promoters.


Conflict of interest statement

The authors declare that they have no competing interests.

Figures

Fig. 1
Fig. 1
CIRCOS plot of differentially methylated positions (DMPs) in AD hippocampus. The CIRCOS plot shows a summary of DNA methylation screening results in the AD hippocampus and its validation by bisulfite cloning sequencing. The perimeter of the circular figure represents the human chromosomes, showing the cytogenetic bands and centromeres (in red). Only those chromosomes harboring DMPs are represented in the painted circles. X and Y chromosomes were excluded from the analysis. The orange circle represents p value for each DMP. The inner red and blue dots represent the results of the differential analysis (beta difference) for each DMPs, including gains in methylation (red dots) and losses in methylation (blue dots). The next green circle reports the names of the genes associated to each DMPs. Those genes associated with neurogenesis are highlighted in red font. In black font, those genes that were validated by bisulfite cloning sequencing are shown
Fig. 2
Fig. 2
Characterization of AD-related DMPs. a The histogram of beta difference value distribution per CpGs shows a clear bias toward the hypermethylated changes (> 0.0) in AD hippocampal samples compared to controls. b The volcano plot shows a greater number of hypermethylated marks (red dots) compared to hypomethylated marks (blue dots) that crossed the statistical thresholds (dotted lines) in this study. The graph also shows that DNA methylation changes in AD hippocampus are mild to moderate in effect size. c The heat map graph reveals that most of the DNA methylation changes represent gains (red squares) in methylation. d Distribution of DMPs regarding gene structure. The bar graph shows the log2 ratios of observed (fraction of differentially methylated probes that overlap a particular region) to expected (fraction of probes selected for analysis that overlap a particular region). S = south, N = north, TSS = transcription start site. e Differential analysis revealed up to 8 AD-related DMPs located within the HOXA genes cluster in the short arm of chromosome 7. The upper tracks show 450K microarray values and results of differential analysis. Blue dots represent per CpG median β-values for patients and controls. Vertical red bars represent β-difference values for CpGs included in the DMPs that crossed the statistical threshold (β-difference > 0.1 and p value < 0.05). Grey bars represent β-difference values for the CpGs included in the DMPs. Methylation values are aligned to ENCODE/Broad data for H3K27me3 histone marks in H1 human Embryonic Stem Cells (H1-hESC) at the bottom. f Dot plot graphs show 450K microarray β-values for the CpGs with most significant p value for each 4 genes within DMPs in the HOXA cluster. The selected CpGs are as follow, HOXA2: cg04027736, HOXA3: cg22962123, HOXA4:cg16651126, EVX1:cg08865099. g Extended mapping of hypermethylated DMPs within HOXA3 gene in 2 AD cases (below) compared to 2 controls (above) obtained by bisulfite cloning sequencing that shows how differential methylation affects multiple contiguous CpGs. The amplicon overlaps cg00921266 (blue arrow) and cg22962123 (red arrow). Black circles represent methylated cytosines while white circles denote unmethylated cytosines. Each column symbolizes a unique CpG site in the examined amplicon, and each line represents an individual DNA clone. Average percentage of methylation for each analyzed sample (control or patient) at this particular amplicon is indicated at the bottom of each sample
Fig. 3
Fig. 3
Validation and extended mapping for the differentially methylated genes HAND2, RBMS1, HIST1H3E, and PAX3. Bisulfite cloning sequencing experiments show that hypermethylation affects multiple contiguous CpGs located in the 3’UTR of HAND2 (a), first exon of RBMS1 (b), the promoter region of HIST1H3E (c), and the body of PAX3 (d). The upper track of each panel shows a genomic map of each gene. White boxes below each gene denote CpG islands, and black boxes represent bisulfite cloning sequencing amplicons. Dot plot graphs show the results of the 450K array (beta values) for CpG probes. Validation results are represented by black/white circle-style figures. Each rectangle corresponds to one sample and shows the methylation pattern at a discrete genomic region surrounding the significant CpG probed by the 450K array which is marked by a red arrow. Black circles represent methylated cytosines while white circles denote unmethylated cytosines. Each column symbolizes a unique CpG site in the examined amplicon, and each line represents an individual DNA clone. Average percentage of methylation for each analyzed sample (control or patient) at this particular amplicon is indicated at the bottom of each sample
Fig. 4.
Fig. 4.
Histone marks enrichment and ChIP results in NHPCs. a The bar graph shows the strong enrichment in repressive histone marks (blue bars), particularly in H3K27me3 and H3K9me3, in our set of AD-related DMPs. Milder enrichment of active chromatin marks (red bars) is also shown. Only statistically significant results of the hypergeometric test for the available histone marks are shown. b DMPs that were hypermethylated occur preferentially in promoters in a poised or bivalent chromatin state. c A variety of fates for “poised” genes in committed NHPCs is represented by the results of ChIP experiments. Some of the promoters resolved to repressive (H3K27me3) or active (H3K4me3) promoters while others lost all histone marks. ChIP of the CCNL1 promoter and gene body regions were used as positive control for active promoter histone marks (H3K4me3) and negative control for repressive histone marks (H3K27me3)

References

    1. Winblad B, Amouyel P, Andrieu S, Ballard C, Brayne C, Brodaty H, et al. Defeating Alzheimer’s disease and other dementias: a priority for European science and society. Lancet Neurol. 2016;15(5):455–532. doi: 10.1016/S1474-4422(16)00062-4. - DOI - PubMed
    1. Blennow K, de Leon MJ, Zetterberg H. Alzheimer’s disease. Lancet. 2006;368(9533):387–403. doi: 10.1016/S0140-6736(06)69113-7. - DOI - PubMed
    1. Reitz C, Brayne C, Mayeux R. Epidemiology of Alzheimer disease. Nat Rev Neurol. 2011;7(3):137–152. doi: 10.1038/nrneurol.2011.2. - DOI - PMC - PubMed
    1. Sanchez-Mut JV, Graff J. Epigenetic alterations in Alzheimer’s disease. Front Behav Neurosci. 2015;9:347. doi: 10.3389/fnbeh.2015.00347. - DOI - PMC - PubMed
    1. Rao JS, Keleshian VL, Klein S, Rapoport SI. Epigenetic modifications in frontal cortex from Alzheimer’s disease and bipolar disorder patients. Transl Psychiatry. 2012;2:e132. doi: 10.1038/tp.2012.55. - DOI - PMC - PubMed

Publication types

MeSH terms