. 2019 Sep;17(9):1945-1957.
doi: 10.1158/1541-7786.MCR-19-0077. Epub 2019 Jun 19.

RETRACTED: KRAS Activation in Gastric Adenocarcinoma Stimulates Epithelial-to-Mesenchymal Transition to Cancer Stem-Like Cells and Promotes Metastasis

Affiliations

RETRACTED: KRAS Activation in Gastric Adenocarcinoma Stimulates Epithelial-to-Mesenchymal Transition to Cancer Stem-Like Cells and Promotes Metastasis

Changhwan Yoon et al. Mol Cancer Res. 2019 Sep.

Retraction in

Abstract

Our previous work showed that in a mouse model of gastric adenocarcinoma with loss of p53 and Cdh1 that adding oncogenic Kras (a.k.a. Tcon mice) accelerates tumorigenesis and metastasis. Here, we sought to examine KRAS activation in epithelial-to-mesenchymal transition (EMT) and generation of cancer stem-like cells (CSC). Transduction of nontransformed HFE-145 gastric epithelial cells with oncogenic KRASG12V significantly decreased expression of the epithelial marker E-cadherin, increased expression of the mesenchymal marker vimentin and the EMT transcription factor Slug, and increased migration and invasion by 15- to 17-fold. KRASG12V also increased expression of self-renewal proteins such as Sox2 and increased spheroid formation by 2.6-fold. In tumor-derived organoids from Tcon mice, Kras knockdown decreased spheroid formation, expression of EMT-related proteins, migration, and invasion; similar effects, as well as reversal of chemoresistance, were observed following KRAS knockdown or MEK inhibition in patient tumor-derived gastric adenocarcinoma cell lines (AGS and KATOIII). KRAS inhibition in gastric adenocarcinoma spheroid cells led to reduced AGS flank xenograft growth, loss of the infiltrative tumor border, fewer lung metastases, and increased survival. In a tissue microarray of human gastric adenocarcinomas from 115 patients, high tumor levels of CD44 (a marker of CSCs) and KRAS activation were independent predictors of worse overall survival. In conclusion, KRAS activation in gastric adenocarcinoma cells stimulates EMT and transition to CSCs, thus promoting metastasis. IMPLICATIONS: This study provides rationale for examining inhibitors of KRAS to block metastasis and reverse chemotherapy resistance in gastric adenocarcinoma patients.


Conflict of interest statement

Conflict of interest: All authors have no conflicts of interest.

Figures
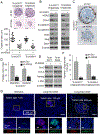
Figure 1.
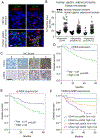
Figure 1.. KRAS knockdown inhibits EMT in tumor organoids from a GA GEMM.
(A) H&E-stained organoids derived from primary gastric tumors (Tcon3077 and Tcon3944) arising in Tcon mice. Graph shows organoid size. Scale bar 50 μm. (B) Western blot for EMT-related proteins in Tcon3077 and Tcon3944 organoids transduced with sh.Kras or sh.Scr. (C) Immunostaining of organoids for Snail. Scale bar 50 μm. (D) Migration and invasion as determined by transwell assays for Tcon3077 cells after transduction with sh.Kras or sh.Scr. (E) Western blot for self-renewal proteins in Tcon3077 and Tcon3944 cells transduced with sh.Kras or sh.Scr and grown as spheroids. β-actin, loading control. (F) Spheroid formation of Tcon3077 and Tcon3944 cells following transduction sh.Kras or sh.Scr. (G) Primary gastric tumors, microscopic lung metastasis, and macroscopic lung metastasis from Tcon mice following immunofluorescence staining for DAPI (blue), CD44 (red) and phospho-MEK1/2 (p-MEK1/2, green). Bars represent standard deviation. *p<0.05 compared to sh.Scr control.
Figure 2.
Figure 2.. Correlation between CD44 expression and RTK-RAS pathway activation and overall survival in patients with resectable GA.
(A-B) Immunofluorescence staining of commercially available tissue array slide containing 40 stomach cancer and 8 corresponding normal tissues for DAPI (blue), CD44 (green), p-MEK1/2 (red), and p-ERK1/2 (red). Scale bar 50 μm. (C) Immunohistochemical staining for CD44 and phospho-MEK1/2 of tumor tissue microarrays (TMAs) created from tumors from patients whose GA was resected at Fujian Medical University Union Hospital (FMUUH; in Fujian, China). Scale bar 50 μm. (D-F) Kaplan-Meier overall survival curves stratified by expression of CD44 (D), phospho-MEK (E) and both CD44 and phospho-MEK (F) in the FMUUH cohort.
Figure 3.
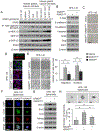
Figure 3.. Oncogenic KRAS promotes EMT and acquisition of CSC phenotypes in gastric epithelial cells.
(A) Western blot for RTK-RAS pathway proteins in gastric epithelial cells and human and mouse gastric cancer cell lines. The presence (MUT) or absence (WT) of an oncogenic KRAS mutation is denoted. (B) Western blot for EMT-related proteins in HFE-145 cells transduced with oncogenic KRAS (KRASG12V), wild-type KRAS (KRASWT) or control (Vector). (C) Morphology of HFE-145 in tissue culture following transduction with KRASG12D, KRASWT, or Vector. Scale bar 10 μm. (D) Confocal photos following immunofluorescent staining of HFE-145 cells transduced with KRASG12D, KRASWT, or Vector for E-cadherin (green) and p-MEK1/2 (red). Scale bar, 20 μm. (E) Migration and invasion assays for HFE-145 cells transduced with KRASG12D, KRASWT, or Vector as determined by transwell assay. (F) Immunofluorescence of HFE-145 spheroids for DAPI (blue), CD44 (green), and Sox2 (red) following transduction with KRASG12D, KRASWT, or Vector. Scale bar 50 μm. (G) Western blot for self-renewal proteins in HFE-145 cells transduced with KRASG12D, KRASWT, or Vector. (H) Photos and graph of HFE-145 cells following transduction of KRASG12D, KRASWT, or Vector and grown in spheroid formation conditions. Scale bar 50 μm. Bars represent standard deviation. *p<0.05.
Figure 4.
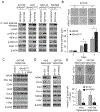
Figure 4.. RTK-RAS pathway controls CSC phenotypes in human GA-derived spheroids.
(A) Western blots for RTK-RAS pathway proteins in KATOIII, AGS, MNK-45, and SNU668 cell grown as monolayers or as spheroids. (B) Single-cell assay in KATOIII spheroid cells following transduction KRASG12D or Vector. Graph shows diameter of spheroids at selected time points when grown in spheroid formation conditions. (C) Western blot analysis of KATOIII cells at selected time points following transduction of Myc-tagged KRASG12D or Vector in spheroid formation condition for levels of total KRAS, Myc tag, CD44, and self-renewal proteins. (D) Western blot of AGS and KATOIII cells transduced with KRAS shRNA (sh.KRAS) or control (sh.Scr). and grown in spheroid formation conditions for KRAS, CD44, and self-renewal proteins. (E) Spheroid formation assay for AGS and KATOIII cells following transduction with sh.KRAS or sh.Scr. Bars represent standard deviation. *p<0.05 compared to control.
Figure 5.
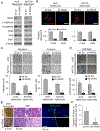
Figure 5.. KRAS knockdown inhibits EMT and infiltrative behavior of human GA-derived cells.
(A) Western blot for KRAS and EMT proteins in spheroids of AGS and KATOIII transduced with sh.KRAS or sh.Scr. (B) Immunofluorescence photos of AGS and KATOIII spheroids for DAPI (blue), E-cadherin (green), and Snail (red) following transduction with sh.KRAS or sh.Scr. Graphs show relative expression of CD44 and Snail. Scale bar, 50 μm. (C-D) Migration and invasion assays (C) and soft agar assay (D) for spheroids of AGS and KATOIII transduced with sh.KRAS or sh.Scr. (E) Tumor and H&E pictures of flank xenografts from AGS cells stably transduced with sh.KRAS or sh.Scr, Photos of immunofluorescence staining with infiltrating cells for DAPI (blue) and Snail (green). Dashed line indicates tumor border. Graph showing number of Snail(+) infiltrating cells. (F) Number of Snail(+) cells infiltrating beyond tumor border. Bars represent standard deviation. *p<0.05 compared to control.
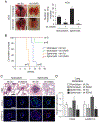
Figure 6.
Figure 6.. KRAS knockdown in GA spheroid cells inhibits experimental metastasis.
Monolayer (2 × 10⁷ cells per mouse) or spheroid AGS cells (1 × 10⁴ cells per mouse) transduced with sh.KRAS or sh.Scr were injected intravenously into 7-week-old SCID mice through the tail vein. (A) Representative images and quantitation of detectable lung nodules on the surface of whole lungs. Dashed lines denote lung nodules. Scale bar 0.5 cm. (B) Kaplan-Meier survival curves for mice injected via tail vein with AGS monolayer and spheroid cells transduced with sh.KRAS or sh.Scr. (C) H&E staining and immunofluorescence for CD44 and phospho-MEK1/2 in tumors derived from indicated cells. Dashed lines denote the lung nodules. Scale bar, 100 μm. (D) Quantitation of immunofluorescence for indicated proteins in lung metastases. Bars represent standard deviation. *p<0.05 compared to control.

Similar articles

Cited by

References

    1. Torre LA, Siegel RL, Ward EM, Jemal A. Global Cancer Incidence and Mortality Rates and Trends--An Update. Cancer Epidemiol Biomarkers Prev 2016;25(1):16–27 doi 10.1158/1055-9965.EPI-15-0578. - DOI - PubMed
    1. Wagner AD, Grothe W, Haerting J, Kleber G, Grothey A, Fleig WE. Chemotherapy in advanced gastric cancer: a systematic review and meta-analysis based on aggregate data. J Clin Oncol 2006;24(18):2903–9 doi 10.1200/JCO.2005.05.0245. - DOI - PubMed
    1. Comprehensive molecular characterization of gastric adenocarcinoma. Nature 2014;513(7517):202–9 doi nature13480 [pii];10.1038/nature13480 [doi]. - DOI - PMC - PubMed
    1. Samatar AA, Poulikakos PI. Targeting RAS-ERK signalling in cancer: promises and challenges. Nat Rev Drug Discov 2014;13(12):928–42 doi 10.1038/nrd4281. - DOI - PubMed
    1. Alison MR, Lin WR, Lim SM, Nicholson LJ. Cancer stem cells: in the line of fire. Cancer Treat Rev 2012;38(6):589–98 doi S0305-7372(12)00054-0 [pii];10.1016/j.ctrv.2012.03.003 [doi]. - DOI - PubMed

Publication types

MeSH terms

Substances