. 2019 Jul 10;6(4):ENEURO.0431-18.2019.
doi: 10.1523/ENEURO.0431-18.2019. Print 2019 Jul/Aug.

Vasopressin Cells in the Rodent Olfactory Bulb Resemble Non-Bursting Superficial Tufted Cells and Are Primarily Inhibited upon Olfactory Nerve Stimulation

Affiliations

Vasopressin Cells in the Rodent Olfactory Bulb Resemble Non-Bursting Superficial Tufted Cells and Are Primarily Inhibited upon Olfactory Nerve Stimulation

Michael Lukas et al. eNeuro. .

Abstract

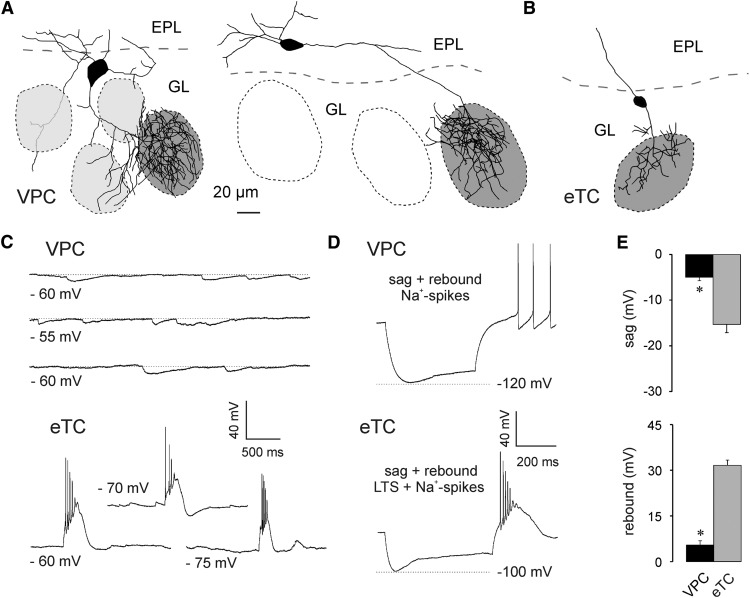
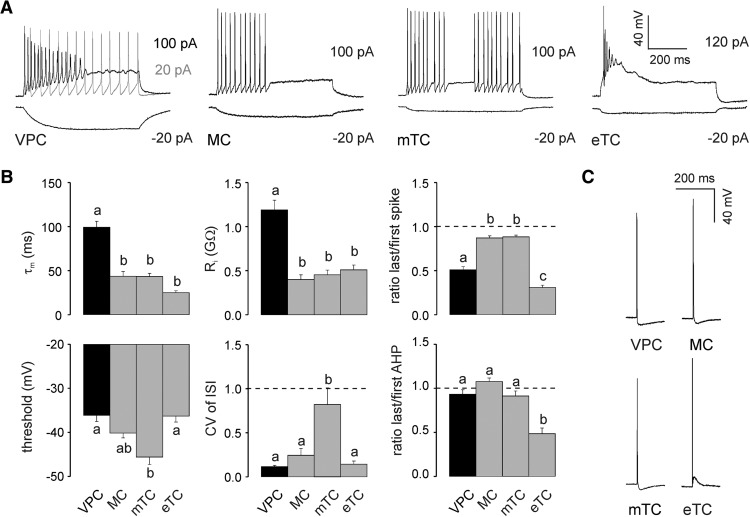
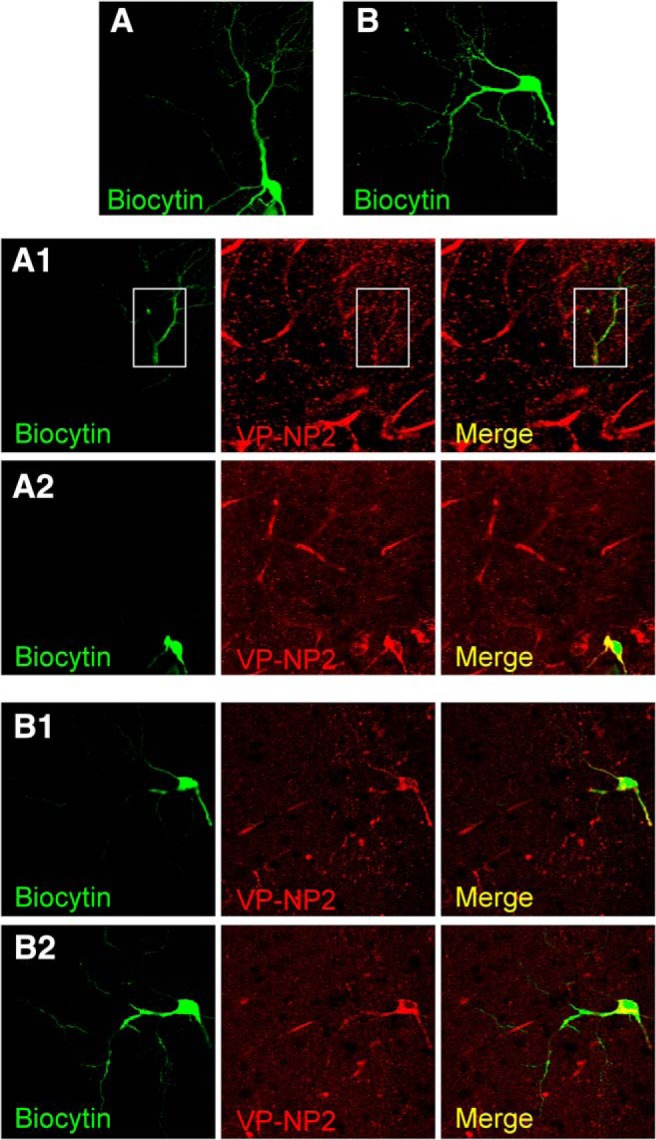
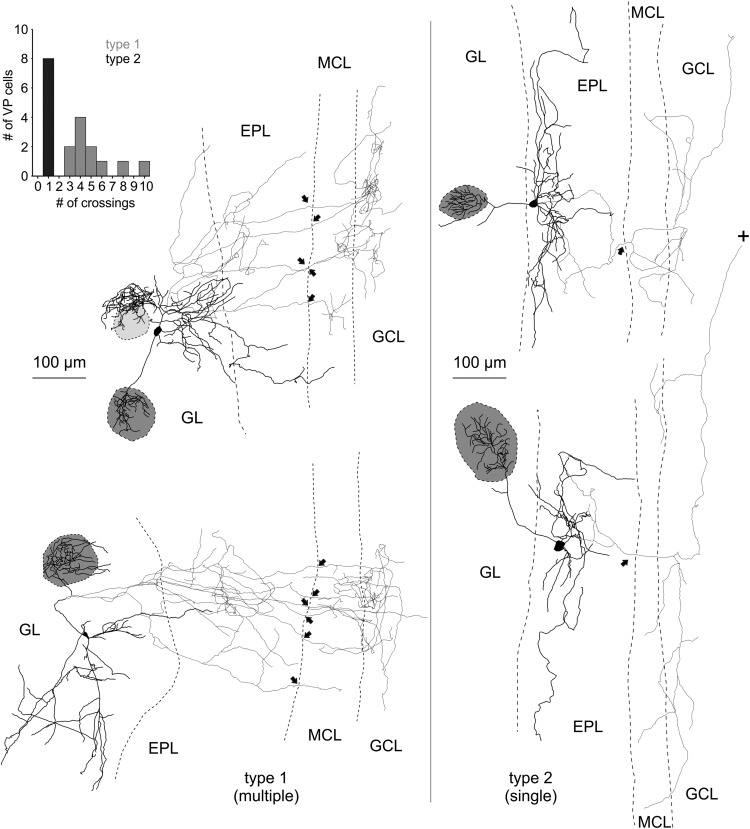
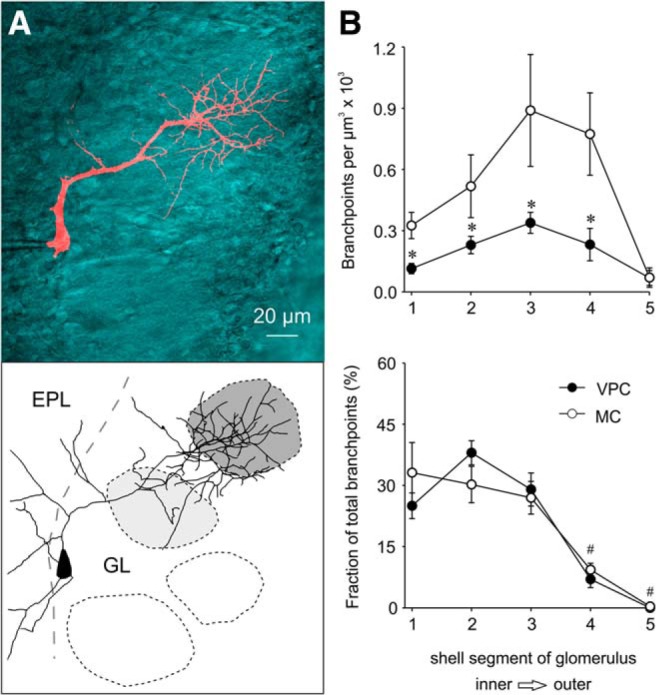
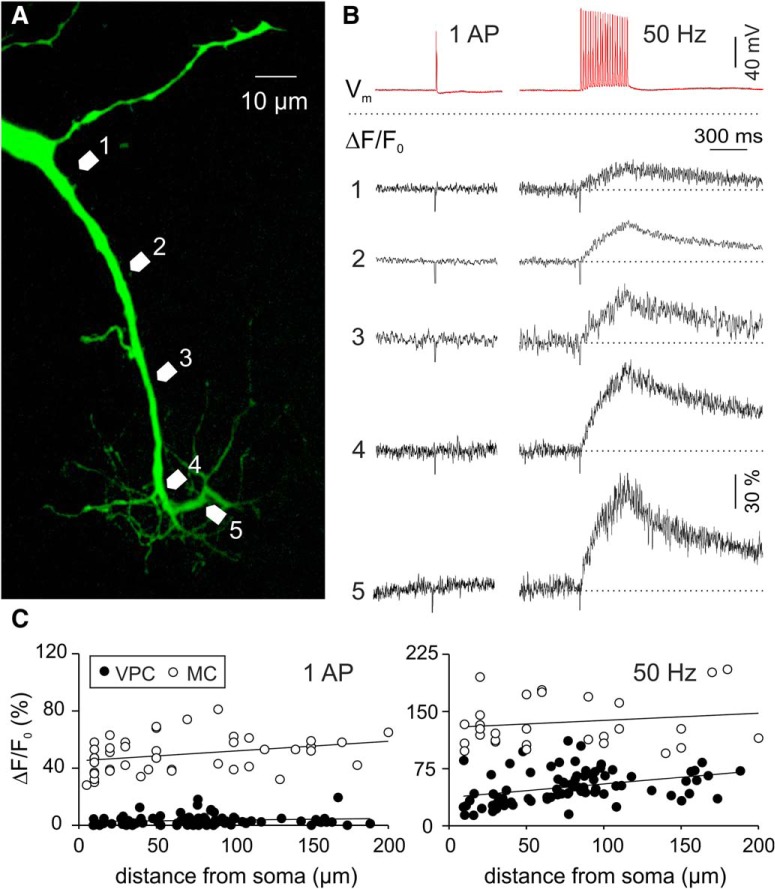
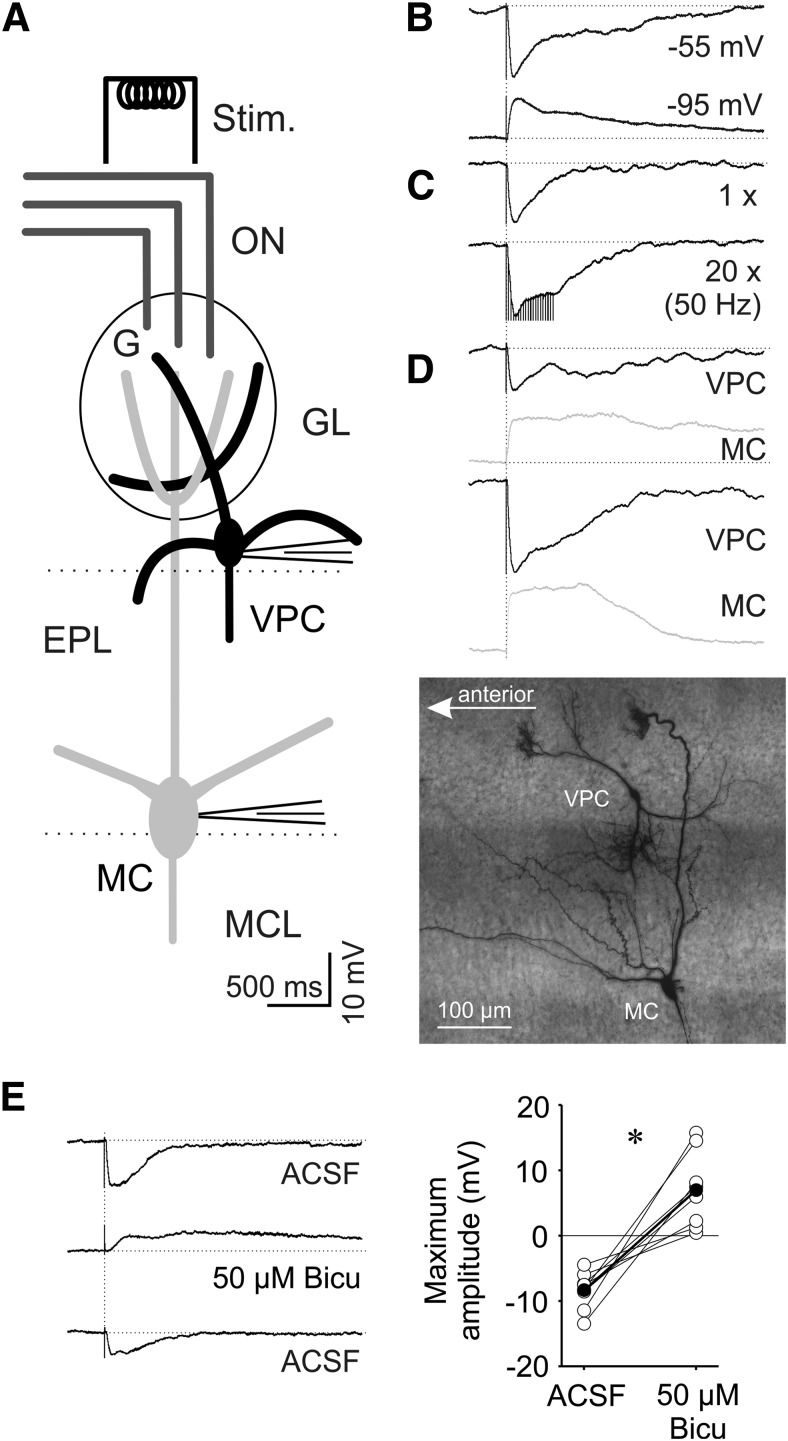
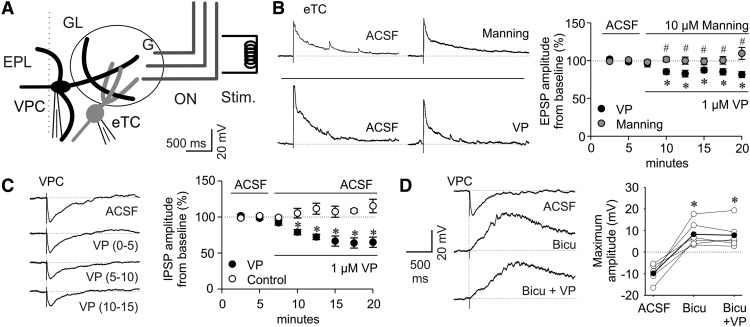
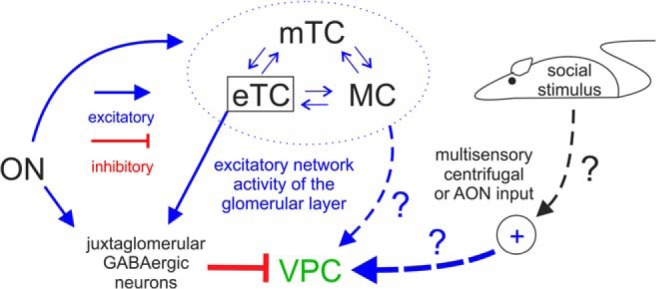
The intrinsic vasopressin system of the olfactory bulb is involved in social odor processing and consists of glutamatergic vasopressin cells (VPCs) located at the medial border of the glomerular layer. To characterize VPCs in detail, we combined various electrophysiological, neuroanatomical, and two-photon Ca2+ imaging techniques in acute bulb slices from juvenile transgenic rats with eGFP-labeled VPCs. VPCs showed regular non-bursting firing patterns, and displayed slower membrane time constants and higher input resistances versus other glutamatergic tufted cell types. VPC axons spread deeply into the external plexiform and superficial granule cell layer (GCL). Axonal projections fell into two subclasses, with either denser local columnar collaterals or longer-ranging single projections running laterally within the internal plexiform layer and deeper within the granule cell layer. VPCs always featured lateral dendrites and a tortuous apical dendrite that innervated a single glomerulus with a homogenously branching tuft. These tufts lacked Ca2+ transients in response to single somatically-evoked action potentials and showed a moderate Ca2+ increase upon prolonged action potential trains.Notably, electrical olfactory nerve stimulation did not result in synaptic excitation of VPCs, but triggered substantial GABAA receptor-mediated IPSPs that masked excitatory barrages with yet longer latency. Exogenous vasopressin application reduced those IPSPs, as well as olfactory nerve-evoked EPSPs recorded from external tufted cells. In summary, VPCs can be classified as non-bursting, vertical superficial tufted cells. Moreover, our findings imply that sensory input alone cannot trigger excitation of VPCs, arguing for specific additional pathways for excitation or disinhibition in social contexts.

Keywords: calcium imaging; electrophysiology; olfactory bulb; social; tufted cells; vasopressin.


Figures

Figure 1.
Figure 1.
A, Two representative VPC reconstructions. The dark gray shading indicates the glomerulus innervated by the dendritic tuft of the respective VPC. VPCs bear several lateral dendrites that either run below the GL or lie above or underneath other glomeruli (light gray shading). B, Representative reconstruction of an eTC. C, Representative spontaneaous IPSPs and bursts of 3 different VPCs and eTCs, respectively. D, Representative responses to somatically applied current steps (−90 to −100 pA; 800 ms) to VPCs and eTCs. E, Cummulative comparison of the sag (top) and the rebound depolarization/LTS (bottom) of VPCs (N = 23) and eTCs (N = 17). * p < 0.001 versus eTC. T-test for independent variables. Data are mean ± SEM.
Figure 2.
Figure 2.
A, Representative responses to somatically applied current steps (600–800 ms) to VPCs, MCs, mTCs, and eTCs at their corresponding resting potential (−55 , −70 , −70 , and −60 mV, respectively). B, Cumulative comparison of the membrane time constant (τm, N = 24/25/18/18), input resistance (Ri, N = 24/25/18/18), firing threshold (N = 24/23/18/18), CV of ISI (N = 22/13/13/7), last/first spike amplitude ratio (N = 24/13/13/11), and last/first afterhyperpolarization (AHP; N = 24/13/13/11) amplitude ratio measured from corresponding current step responses (see A). C, Representative APs evoked by somatic current injection (1000 pA, 1 ms). Arabic letters above columns illustrate whether means are statistically different (e.g., a versus b vs c) or not (e.g., a versus a vs ab). One-way ANOVA followed by post hoc comparison using Bonferroni correction. Data are means ± SEM.
Figure 3.
Figure 3.
A, B, Average z-projections of eGFP-VPCs labeled with biocytin (visualized with streptavidin-conjugated CF488A) and corresponding staining of VP-Neurophysin 2 (VP-NP2, CF633).
Figure 4.
Figure 4.
Reconstructions of eGFP-VPCs labeled with biocytin. Two representative examples of type 1 (multiple innervation of MCL; left) and type 2 cells (single top-down innervation of MCL; right). +, Truncation of axonal projection; arrows, site of axonal MCL crossing from EPL into GCL. The dark gray shading indicates the glomerulus innervated by the dendritic tuft of the respective VPC. Light gray shading indicates that dendrites lie above or below respective glomerulus. The VPC in the top left displays a conspicuous dendritic ramification that does not enter the adjacent glomerulus. Similar structures were found in 4 of 35 reconstructed cells. Inset, Number of crossings versus number of cells.
Figure 5.
Figure 5.
A, Maximal z-projection of a VPC filled with AlexaFluor 594 and overlaid with the single z-plane of the trans-infrared channel that showed the maximal extent of the innervated glomerulus. Bottom, Reconstruction of cell above. The dark gray shading indicates the glomerulus innervated by the dendritic tuft of the respective VPC. The other glomeruli have no contact with the VPC (white) or lie above or underneath the dendrites of the VPC (light gray shading). Imaging was performed in acute slices (300 µm) using two-photon laser scanning microscopy. B, Density of branch points and fraction of total branch points within shell segments of the respective glomerulus in VPCs (n = 13) and MCs (n = 8). Statistical comparisons indicate a lower branch point density but similar branch point distribution in VPCs compared with MCs. * p < 0.05 versus respective MC; # p < 0.05 versus segment 1 + 2; mixed-model ANOVA followed by post hoc test with Bonferroni correction. MC, mitral cell; VPC, vasopressin cell.
Figure 6.
Figure 6.
A, Two-photon scan of a representative VPC filled with the Ca2+-sensitive dye OGB-1. Numbered arrows in the scan correspond to the locations of the numbered averaged (n = 4) ΔF/F transients shown in B, in response to a single somatically-evoked AP (1000 pA, 1 ms) or a 50 Hz train (20 APs, 50 Hz, 400 ms). C, ΔF/F of apical dendrites and tufts versus distance from soma in VPCs (N = 11) and MCs (N = 13). MC, mitral cell; VPC, vasopressin cell.
Figure 7.
Figure 7.
A, Schematic drawing of experimental setup. Whole-cell patch-clamp recordings in 300 µm in vitro slices of responses to electrical ON stimulation (400 µA, 100 µs, 30 s intervals). B, Representative averaged (10 traces) ON-evoked IPSPs recorded from a VPC at resting potential of −55 mV (total N = 97) and hyperpolarized to −95 mV (total N = 7). C, Representative averaged (10 traces) ON-evoked IPSPs stimulated one time and 20 times at 50 Hz recorded from a VPC at resting potential of −55 mV (N = 3). D, Representative averaged PSPs from two pairs of VPCs and MCs sequentially stimulated, but at the same location within the same slice (image: maximal z-projection of a representative pair of a VPC and MC from this experiment visualized by subsequent biocytin-DAB staining). E, Bath application of 50 µM bicuculline (competetive GABAA receptor antagonist). Left, Representative averaged (10 traces) ON-evoked PSPs recorded from a VPC. Right, Cumulative presentation of bicuculline effect on PSP amplitudes (N = 8). Empty dots represent single measurements, whereas filled dots represent means. *p < 0.05 versus ACSF. T-test for dependent variables. Amplitudes of stimulus artifacts were truncated. Bicu, bicuculline; G, glomerulus.
Figure 8.
Figure 8.
A, Schematic drawing of experimental setup. Whole-cell patch-clamp recordings from VPCs or eTCs of responses to electrical ON stimulation (20–400 µA, 100 µs, 30 s intervals). Bath application of 1 µM VP or 10 µM of a VP receptor antagonist (Manning compound). B, Left, Representative averaged (10 traces) ON-evoked EPSPs recorded from a eTC. Right, Cumulative averaged (5 traces) presentation of VP/Manning compound effect on EPSP Amplitudes (N = 8/7). C, Representative averaged (10 traces) ON-evoked PSPs recorded from a VPC and cumulative averaged (5 traces) presentation of 1µm VP effect on IPSP Amplitudes (N = 6, numbers in brackets represent time bins in minutes after VP). D, Bath application of 50 µm bicuculline (competetive GABAA receptor antagonist) and 1 µm VP. Left, Representative averaged (10 traces) ON-evoked IPSPs recorded from a VPC. Right, Cumulative presentation of bicuculline/VP effect on PSP amplitudes (N = 6). Empty dots represent single measurements, whereas filled dots represent means. Data points are mean ± SEM. *p < 0.05 versus corresponding ACSF. #p > 0.999 versus ACSF. T test for dependent variable (D). Mixed-model ANOVA followed by post hoc test with Bonferroni correction (B, C). Amplitudes of stimulus artifacts were truncated. Bicu, Bicuculline; G, glomerulus.
Figure 9.
Figure 9.
Graphic summary of detected inputs to olfactory bulb VPCs. Blue arrows represent excitatory inputs indicated by this study and from the literature. Red lines represent inhibitory inputs indicated by this study. The strength of the lines indicates the strength of the input. The cells within the dashed blue circle indicate the excitatory network within the same home glomerulus. Arrows labeled with question marks indicate speculative excitatory inputs to VPCs.

Similar articles

Cited by

References

    1. Abraham NM, Egger V, Shimshek DR, Renden R, Fukunaga I, Sprengel R, Seeburg PH, Klugmann M, Margrie TW, Schaefer AT, Kuner T (2010) Synaptic Inhibition in the olfactory bulb accelerates odor discrimination in mice. Neuron 65:399–411. 10.1016/j.neuron.2010.01.009 - DOI - PMC - PubMed
    1. Antal M, Eyre M, Finklea B, Nusser Z (2006) External tufted cells in the main olfactory bulb form two distinct subpopulations. Eur J Neurosci 24:1124–1136. 10.1111/j.1460-9568.2006.04988.x - DOI - PMC - PubMed
    1. Aroniadou-Anderjaska V, Ennis M, Shipley MT (1999) Dendrodendritic recurrent excitation in mitral cells of the rat olfactory bulb. J Neurophysiol 82:489–494. 10.1152/jn.1999.82.1.489 - DOI - PubMed
    1. Aungst JL, Heyward PM, Puche AC, Karnup SV, Hayar A, Szabo G, Shipley MT (2003) Centre-surround inhibition among olfactory bulb glomeruli. Nature 426:623. 10.1038/nature02185 - DOI - PubMed
    1. Bader A, Klein B, Breer H, Strotmann J (2012) Connectivity from OR37 expressing olfactory sensory neurons to distinct cell types in the hypothalamus. Front Neural Circuits 6:84 10.3389/fncir.2012.00084 - DOI - PMC - PubMed

Publication types