. 2019 Aug 13;93(17):e00957-19.
doi: 10.1128/JVI.00957-19. Print 2019 Sep 1.

Human Cytomegalovirus Compromises Development of Cerebral Organoids

Affiliations

Human Cytomegalovirus Compromises Development of Cerebral Organoids

Rebecca M Brown et al. J Virol. .

Abstract

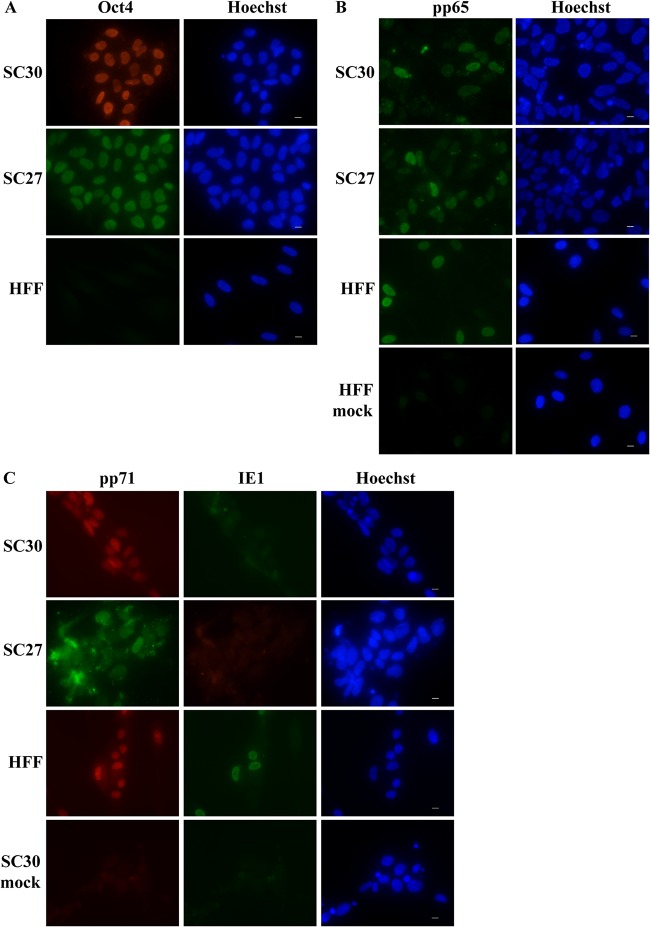
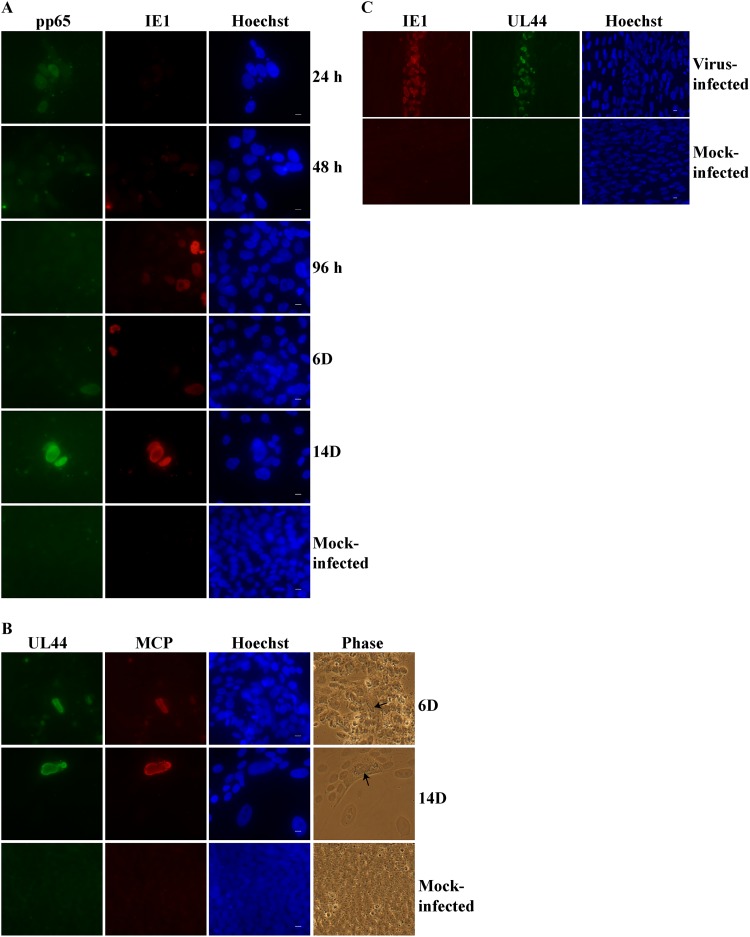
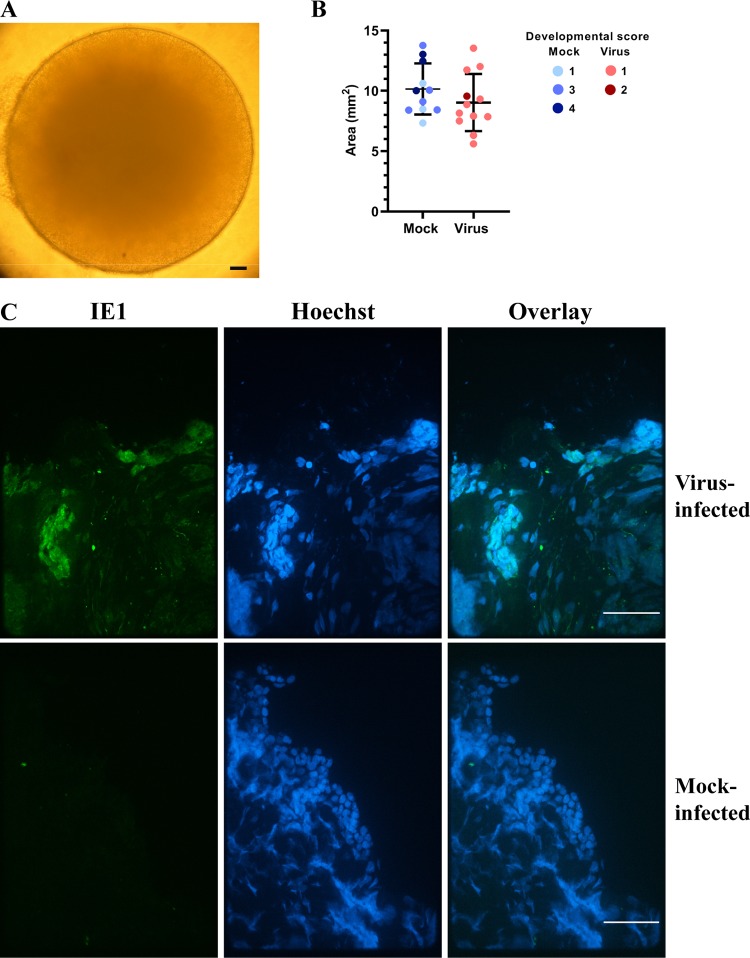
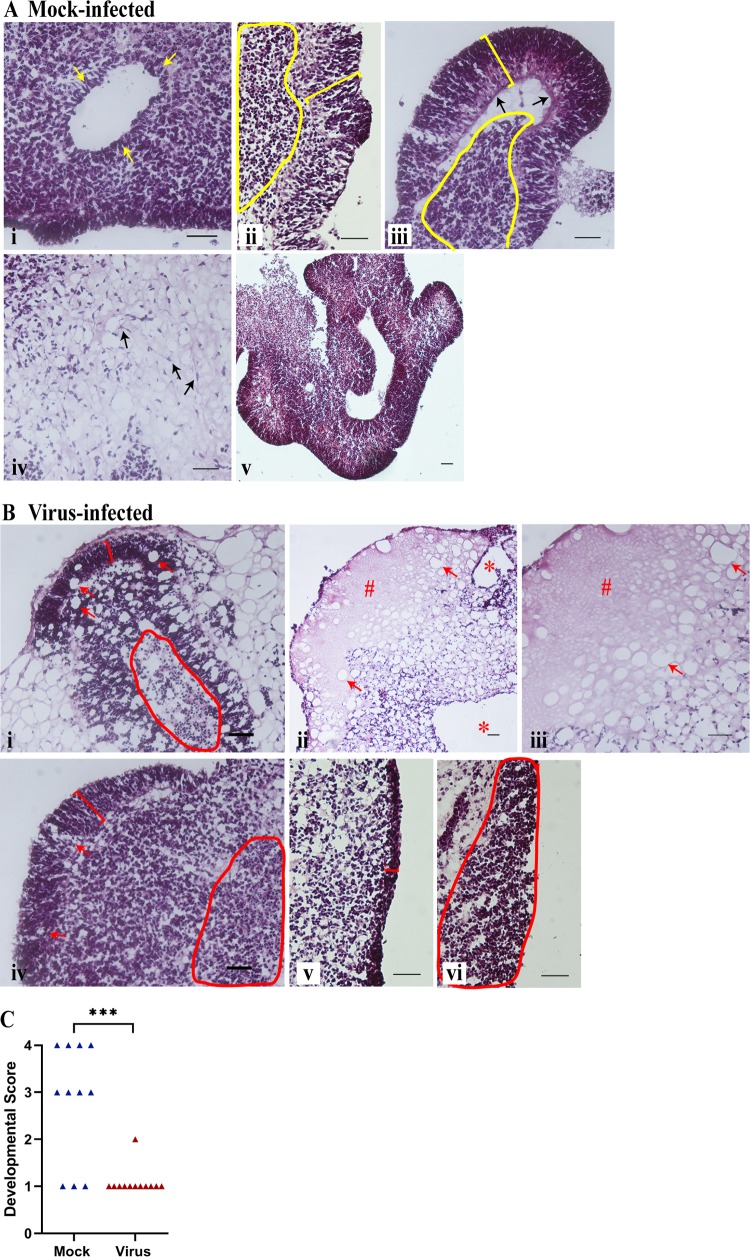
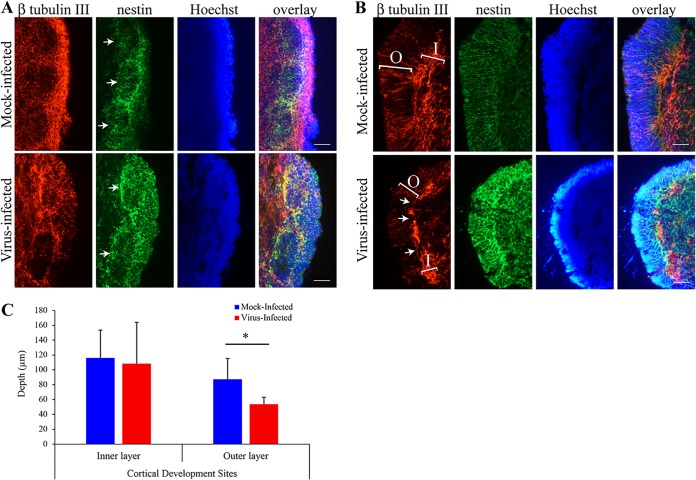
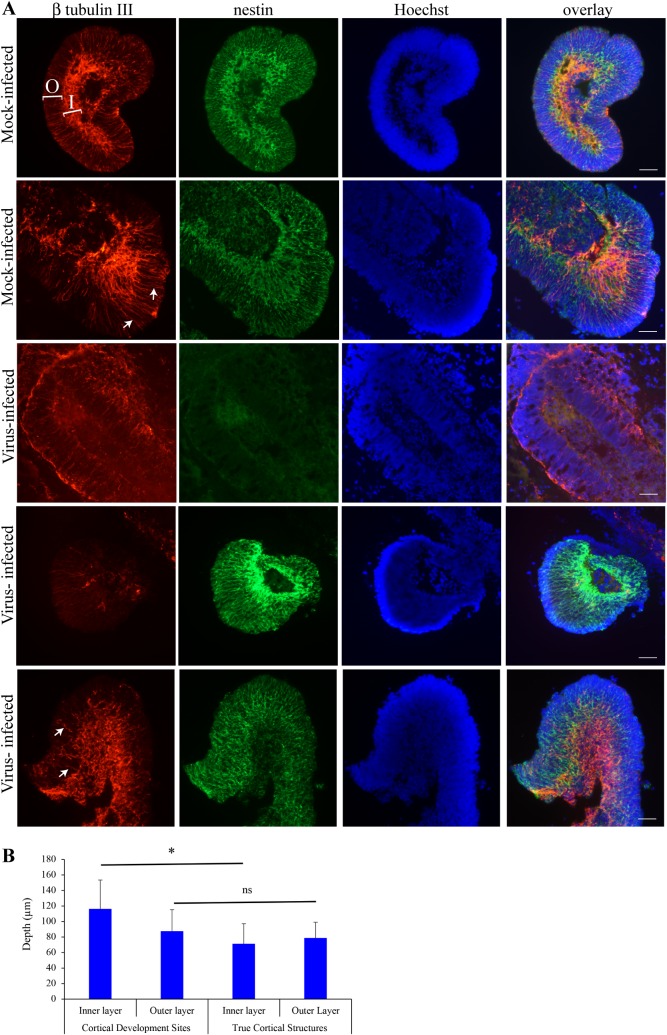
Congenital human cytomegalovirus (HCMV) infection causes a broad spectrum of central and peripheral nervous system disorders, ranging from microcephaly to hearing loss. These ramifications mandate the study of virus-host interactions in neural cells. Neural progenitor cells are permissive for lytic infection. We infected two induced pluripotent stem cell (iPSC) lines and found these more primitive cells to be susceptible to infection but not permissive. Differentiation of infected iPSCs induced de novo expression of viral antigens. iPSCs can be cultured in three dimensions to generate cerebral organoids, closely mimicking in vivo development. Mock- or HCMV-infected iPSCs were subjected to a cerebral organoid generation protocol. HCMV IE1 protein was detected in virus-infected organoids at 52 days postinfection. Absent a significant effect on organoid size, infection induced regions of necrosis and the presence of large vacuoles and cysts. Perhaps more in parallel with the subtler manifestations of HCMV-induced birth defects, infection dramatically altered neurological development of organoids, decreasing the number of developing and fully formed cortical structure sites, with associated changes in the architectural organization and depth of lamination within these structures, and manifesting aberrant expression of the neural marker β-tubulin III. Our observations parallel published descriptions of infected clinical samples, which often contain only sparse antigen-positive foci yet display areas of focal necrosis and cellular loss, delayed maturation, and abnormal cortical lamination. The parallels between pathologies present in clinical specimens and the highly tractable three-dimensional (3D) organoid system demonstrate the utility of this system in modeling host-virus interactions and HCMV-induced birth defects.IMPORTANCE Human cytomegalovirus (HCMV) is a leading cause of central nervous system birth defects, ranging from microcephaly to hearing impairment. Recent literature has provided descriptions of delayed and abnormal maturation of developing cortical tissue in infected clinical specimens. We have found that infected induced pluripotent stem cells can be differentiated into three-dimensional, viral protein-expressing cerebral organoids. Virus-infected organoids displayed dramatic alterations in development compared to those of mock-infected controls. Development in these organoids closely paralleled observations in HCMV-infected clinical samples. Infection induced regions of necrosis, the presence of larger vacuoles and cysts, changes in the architectural organization of cortical structures, aberrant expression of the neural marker β-tubulin III, and an overall reduction in numbers of cortical structure sites. We found clear parallels between the pathologies of clinical specimens and virus-infected organoids, demonstrating the utility of this highly tractable system for future investigations of HCMV-induced birth defects.

Keywords: cerebral organoid; cortical development; human cytomegalovirus; induced pluripotent stem cells; neural marker expression.


Figures

FIG 1
FIG 1
iPSCs were susceptible but not permissive to HCMV infection. (A) iPSC lines showed strong staining for the pluripotency marker Oct4. (B and C) Two iPSC lines and HFFs, used as controls, were infected at an MOI of 5 or mock infected and harvested at 5 hpi (B) and 24 hpi (C). Susceptibility of iPSCs was established by staining for tegument proteins pp65 and pp71, as indicated. No new viral protein expression was observed from iPSCs, as evidenced by a lack of IE1 staining (C). Hoechst was used to counterstain the nuclei in all fluorescence images. Scale bar, 10 μm.
FIG 2
FIG 2
Differentiation of SC30 iPSCs induced expression of viral Ags. (A and B) Monolayers of SC30 iPSCs on coverslips were infected at an MOI of 5 or mock infected and subjected to the cerebral organoid differentiation protocol. Coverslips were harvested at the indicated times p.i. In the experiment shown in panel A, coverslips were stained for entry of virus (24 hpi) with Ab against pp65. Subsequent staining for pp65 detected newly expressed protein (beginning at 6 days [D] p.i.). Coverslips were also stained at all time points shown for new viral Ag expression with Ab against IE1. In the experiment shown in panel B, coverslips were stained at 6 days and 14 days p.i. with Abs against the viral processivity factor, UL44 (Early Ag) and the major capsid protein, MCP (Early-Late Ag) to detect signs of viral replication. Arrows within phase-contrast images point to viral replication centers within nuclei of virus-infected cells. (C) SC30 iPSCs at 14 days p.i. were trypsinized, counted, and then seeded onto a monolayer of HFFs for coculture experiments. Ag+ foci were detected at 12 days postseeding by staining with Abs against IE1 and UL44. Scale bar, 10 μm.
FIG 3
FIG 3
Virus-infected organoids were not significantly smaller but showed focal areas of IE positivity. (A) An example of an EB with smooth edges and bright, optically translucent, radially organized neuroectodermal tissue. Scale bar, 50 μm. (B) The area of all mock- and virus-infected organoids was estimated using stereoscopic images, as described in Materials and Methods. Each organoid is represented by a circle, colored according to the developmental score assigned in Table 1. No statistically significant difference was detected in organoid sizes. (C) A whole virus-infected organoid was stained with Ab against IE1 and then embedded and sectioned as described in Materials and Methods. Images show an example of a section with focal IE1 positivity (top). Bottom panels show specificity of Ab staining using a mock-infected organoid incubated for the same length of time prior to embedding. Scale bar, 50 μm.
FIG 4
FIG 4
Histological analysis revealed dramatic developmental changes in HCMV-infected organoids. Mock-infected and HCMV-infected organoids were harvested after 52 days of growth and processed for H&E analysis as described in Materials and Methods. (A) Examples of rosettes (frame i, organoid A), laminated cortical development sites (ii, organoid A), true-cortical structures (iii and v, organoid A), and honeycomb-tissue (iv, organoid O) in mock-infected organoids. In rosettes, the single layer of epithelial cells is marked with yellow arrows (frame i); in cortical development sites and true-cortical structures, the nonlaminated masses of neurons and support cells are outlined in yellow (ii and iii), the cortical lamination is marked by yellow brackets (ii and iii), and the scaffold is marked by black arrows (iii). In the honeycomb-tissue, spindle-shaped cells with long cytoplasmic processes are marked with black arrows (frame iv). (B) Examples of histopathological changes due to infection in virus-infected organoid true-cortical structures (frame i, organoid C), honeycomb-tissue (ii and iii, organoid C), and cortical development sites (iv, v, and vi, organoids H, E and M, respectively). Examples of areas of necrosis are outlined in red (frames i and iv), large vacuoles in true-cortical structure (i) and honeycomb-tissue (ii and iii) are marked with red arrows, cysts and acellular regions within honeycomb-tissue are marked with asterisks (*) and number signs (#), respectively (ii and iii). In cortical development sites, thinner/less developed lamination is marked with red brackets (frames iv and v), and largely disorganized lamination is circled in red (vi). Fragmented clusters of cells in a cortical development site are marked with red arrows (frame iv). Scale bar, 50 μm. (C) Developmental scores of each mock- and virus-infected organoid is plotted for comparison of the populations as a whole. Mock-infected organoids are statistically significantly more developed. ***, P < 0.001.
FIG 5
FIG 5
Neuronal marker staining revealed changes in lamination depths and aberrations in β-tubulin III staining in cortical development sites of virus-infected organoids. To detect the presence of neurons, representative slides from the middle of the organoids were stained with nestin and β-tubulin III. Sections from nine different mock-infected and nine different HCMV-infected organoids were stained. (A) Examples of rosette-like structures in mock-infected (organoid V) and HCMV-infected (organoid K) organoids. Rosette-like structures are marked with white arrows in nestin-stained panels. (B) Examples of laminated cortical development sites in mock-infected (organoid A) and HCMV-infected (organoid H) organoids. The outer lamination layer (O) and depth of the interior β-tubulin III+ cells (I) are marked by white brackets. White arrows point to gaps in β-tubulin III+ staining in the virus-infected organoid. Scale bar, 50 μm. (C) Comparison of depths of interior β-tubulin III+ cells (inner layer) and lamination (outer layer) between mock- and virus-infected organoids as described in Materials and Methods. Six sites representing four different mock-infected organoids and seven sites representing four different virus-infected organoids were used for cortical development site analysis. *, P < 0.05.
FIG 6
FIG 6
Neuronal marker staining revealed aberrations in β-tubulin III staining in true-cortical structures of virus-infected organoids. (A) Examples of true cortical structures in mock-infected (organoid L, top row; organoid A, second row) and HCMV-infected (organoid C, third row; organoid H, fourth row; organoid K, bottom row) organoids. The depth of the outer lamination layer (O) and depth of the interior β-tubulin III+ cells (I) are marked by white brackets (top row). Projections of β-tubulin III are marked with white arrows in mock-infected organoid (second row) and virus-infected organoid (bottom row). Virus-infected organoids show substantially decreased staining for both proteins (third row), only nestin staining (fourth row), or decreased and aberrant staining of β-tubulin III (bottom row). Scale bar, 50 μm. (B) Comparison of depths of interior β-tubulin III+ cells (inner layer) and lamination (outer layer) between mock-infected organoid cortical development sites and true-cortical structures. Cortical development site measurements are the same as presented in Fig. 5C. Nine structures from three different mock-infected organoids were used for true-cortical structure analysis. *, P < 0.05; ns, not significant.

Similar articles

Cited by

References

    1. Cannon MJ, Davis KF. 2005. Washing our hands of the congenital cytomegalovirus disease epidemic. BMC Public Health 5:70. doi:10.1186/1471-2458-5-70. - DOI - PMC - PubMed
    1. Boppana SB, Fowler KB, Britt WJ, Stagno S, Pass RF. 1999. Symptomatic congenital cytomegalovirus infection in infants born to mothers with preexisting immunity to cytomegalovirus. Pediatrics 104:55–60. doi:10.1542/peds.104.1.55. - DOI - PubMed
    1. Britt W, Alford C. 1996. Cytomegalovirus, p 2493–2523. In Fields BN, Knipe DM, Howley PM (ed), Fields virology, 3rd ed Lippincott-Raven Publishers, Philadelphia, PA.
    1. Cinque P, Marenzi R, Ceresa D. 1997. Cytomegalovirus infections of the nervous system. Intervirology 40:85–97. doi:10.1159/000150536. - DOI - PubMed
    1. Fowler KB, McCollister FP, Dahle AJ, Boppana S, Britt WJ, Pass RF. 1997. Progressive and fluctuating sensorineural hearing loss in children with asymptomatic congenital cytomegalovirus infection. J Pediatr 130:624–630. doi:10.1016/S0022-3476(97)70248-8. - DOI - PubMed

Publication types

MeSH terms