. 2019 Jun 20;4(12):e126124.
doi: 10.1172/jci.insight.126124.

Antisense oligonucleotide treatment ameliorates IFN-γ-induced proteinuria in APOL1-transgenic mice

Affiliations

Antisense oligonucleotide treatment ameliorates IFN-γ-induced proteinuria in APOL1-transgenic mice

Mariam Aghajan et al. JCI Insight. .

Abstract

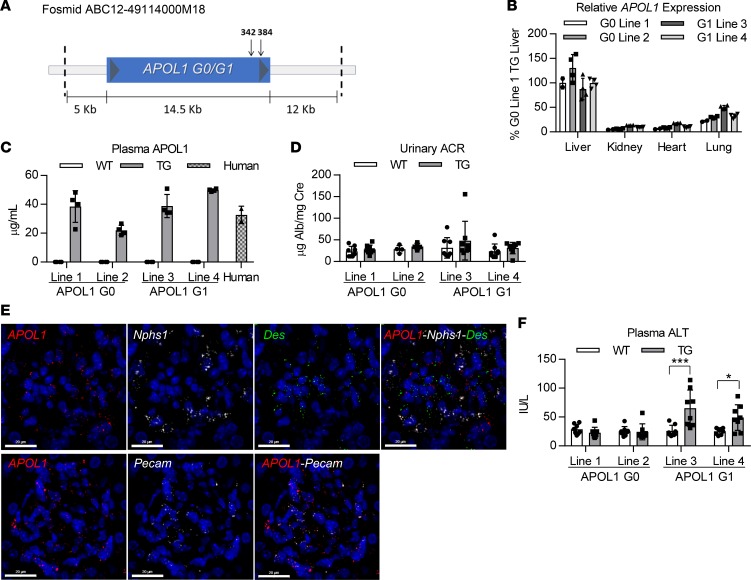
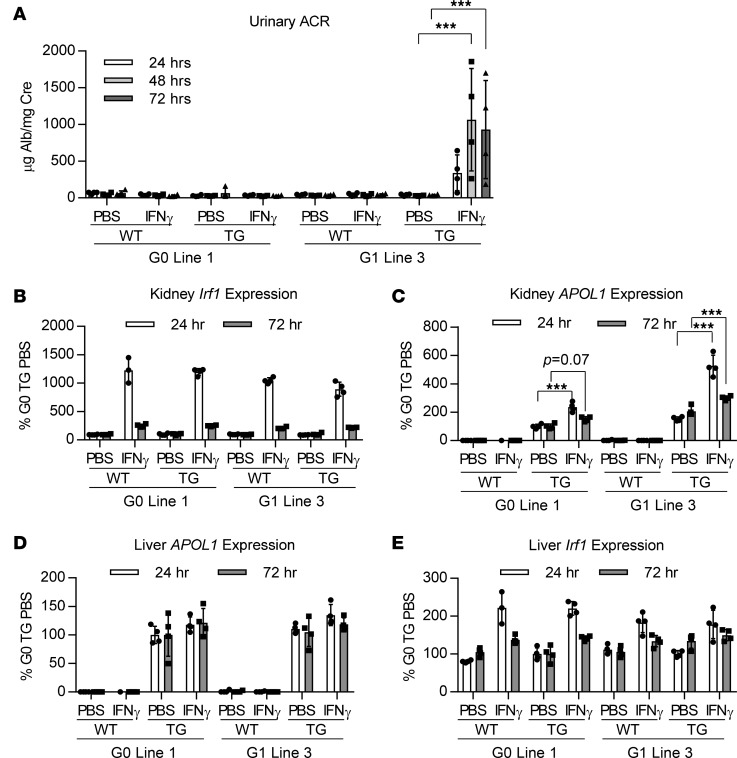
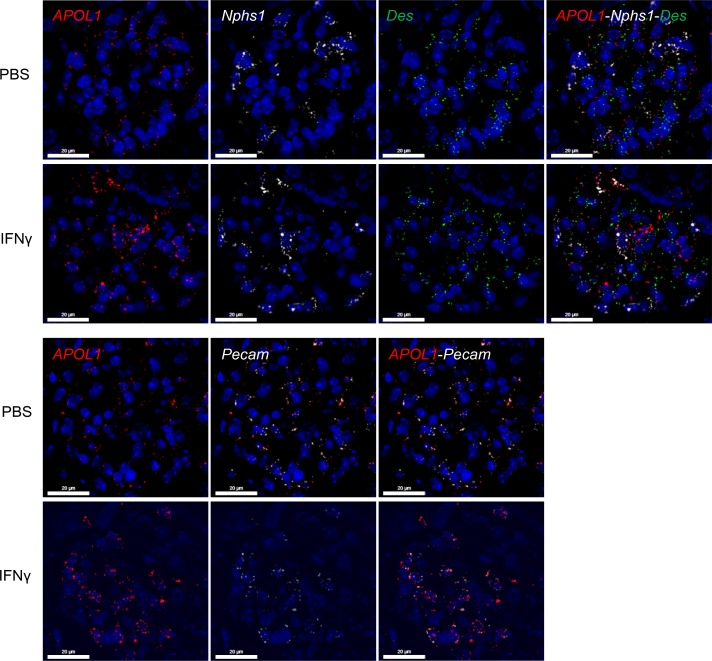
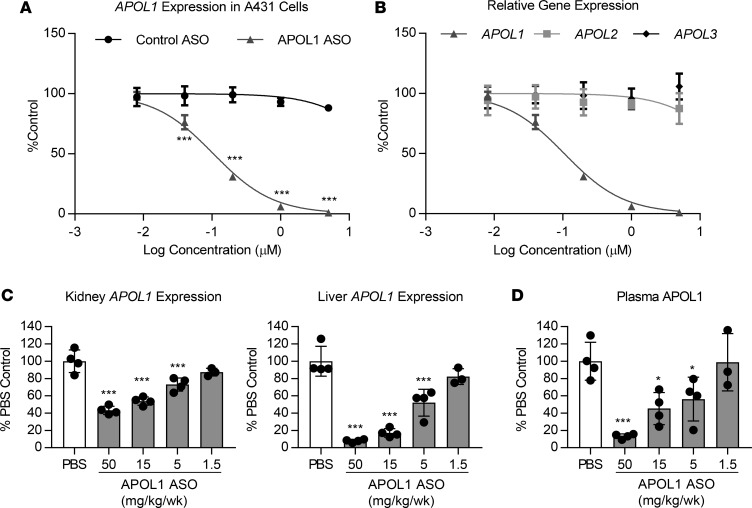
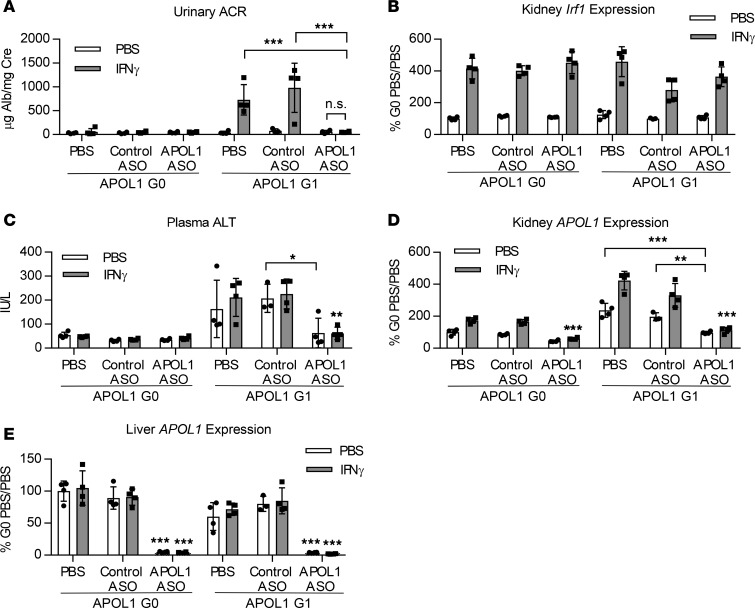
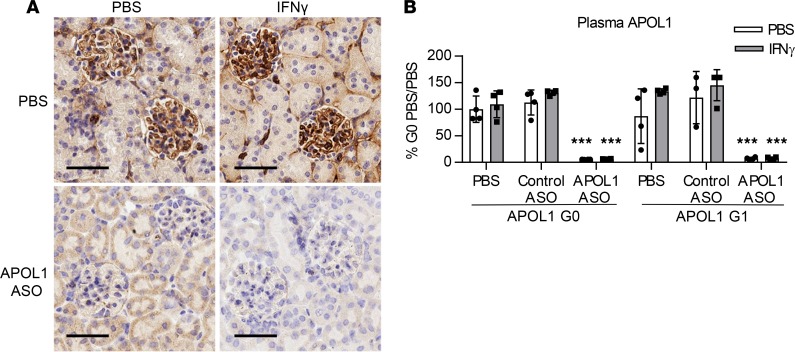
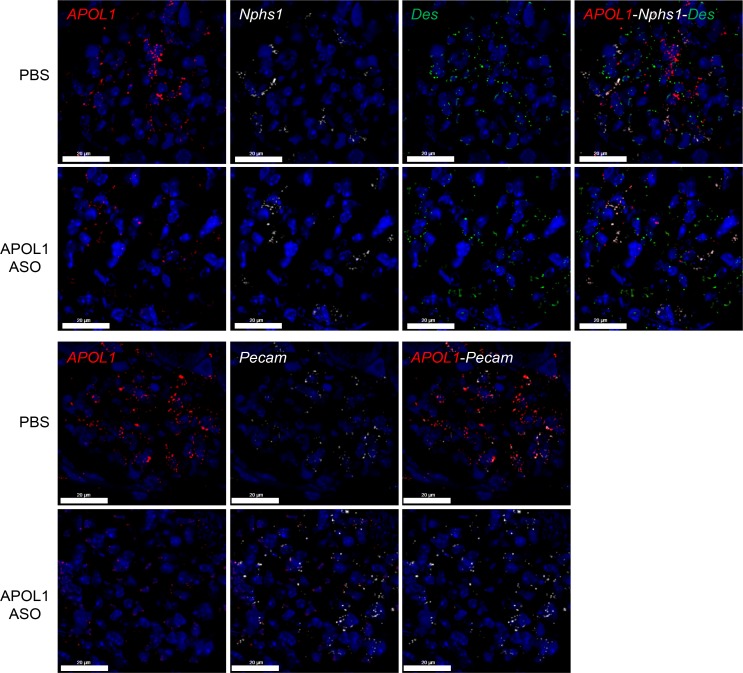
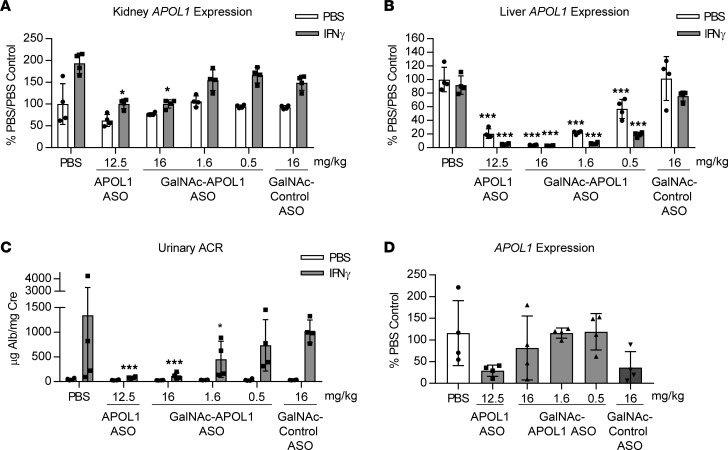
African Americans develop end-stage renal disease at a higher rate compared with European Americans due to 2 polymorphisms (G1 and G2 risk variants) in the apolipoprotein L1 (APOL1) gene common in people of African ancestry. Although this compelling genetic evidence provides an exciting opportunity for personalized medicine in chronic kidney disease, drug discovery efforts have been greatly hindered by the fact that APOL1 expression is lacking in rodents. Here, we describe a potentially novel physiologically relevant genomic mouse model of APOL1-associated renal disease that expresses human APOL1 from the endogenous human promoter, resulting in expression in similar tissues and at similar relative levels as humans. While naive APOL1-transgenic mice did not exhibit a renal disease phenotype, administration of IFN-γ was sufficient to robustly induce proteinuria only in APOL1 G1 mice, despite inducing kidney APOL1 expression in both G0 and G1 mice, serving as a clinically relevant "second hit." Treatment of APOL1 G1 mice with IONIS-APOL1Rx, an antisense oligonucleotide (ASO) targeting APOL1 mRNA, prior to IFN-γ challenge robustly and dose-dependently inhibited kidney and liver APOL1 expression and protected against IFN-γ-induced proteinuria, indicating that the disease-relevant cell types are sensitive to ASO treatment. Therefore, IONIS-APOL1Rx may be an effective therapeutic for APOL1 nephropathies and warrants further development.

Keywords: Drug therapy; Genetic diseases; Mouse models; Nephrology; Therapeutics.


Conflict of interest statement

Conflict of interest: MA, SLB, CEH, JO, SK, DG, ATW, JAE, BPM, and SG are employees and shareholders of Ionis Pharmaceuticals. MA, AE, IM, AML, JH, CA, and MCM are or were employees and shareholders of AstraZeneca.

Figures

Figure 1
Figure 1. Genomic APOL1-transgenic mice express APOL1 in similar tissues as those observed in humans and at similar relative physiological levels.
(A) Schematic of the human APOL1-containing fosmid fragment used to generate APOL1 G0– and G1–transgenic mice. Arrows mark the protein coding sequence location of the 2 point mutations that constitute the G1 genotype. (B) Relative APOL1 expression levels in livers, kidneys, hearts, and lungs of transgenic mice (n = 2–4) were measured by qRT-PCR and normalized to total RNA. Data from 2 different founder lines are shown for each genotype. (C) APOL1 plasma levels in transgenic mice (n = 4) and human pooled plasma (n = 2) were measured by ELISA. (D) Urine albumin levels of APOL1-transgenic and WT littermate mice (n = 4–8) were measured by albumin ELISA and normalized to urine creatinine levels. (E) FISH was used to evaluate APOL1 mRNA expression in podocytes (Nphs1), mesangial cells (Des), and endothelial cells (Pecam) in APOL1 G1 mouse kidneys (n = 4). Representative images shown (scale bar: 20 μm). (F) Plasma ALT levels of APOL1-transgenic and WT littermate mice (n = 8) were measured using a clinical chemistry analyzer. Two-way ANOVA with Bonferroni’s multiple comparisons test, *P < 0.05; ***P < 0.001. All data are presented as mean ± SD.
Figure 2
Figure 2. IFN-γ induces kidney APOL1 expression in APOL1 G0 and G1 mice, but proteinuria only in G1 mice.
Female APOL1 G0– and G1–transgenic and WT littermate mice (n = 3–4) were challenged with a single dose of IFN-γ (1.125 × 10⁷ U/kg) or vehicle (PBS). (A) Urine was collected 24, 48, and 72 hours after IFN-γ challenge, and urinary albumin was measured by ELISA and normalized to urine creatinine. (B) Kidney Irf1 expression was measured by qRT-PCR 24 and 72 hours after IFN-γ challenge and normalized to Cyp expression. (C) Kidney and (D) liver APOL1 expression were measured by qRT-PCR 24 and 72 hours after IFN-γ challenge and normalized to Cyp expression. (E) Liver Irf1 expression was measured by qRT-PCR 24 and 72 hours after IFN-γ challenge and normalized to Cyp expression. All data are presented as mean ± SD. Two-way ANOVA with Tukey’s multiple comparisons test, ***P < 0.001.
Figure 3
Figure 3. IFN-γ induces kidney APOL1 expression in podocytes and endothelial cells in the kidney.
Female APOL1 G1–transgenic mice (n = 4) were challenged with a single dose of IFN-γ (1.125 × 10⁷ U/kg) or vehicle (PBS). FISH was used to evaluate APOL1 mRNA expression in podocytes (Nphs1), mesangial cells (Des), and endothelial cells (Pecam) in APOL1 G1 mouse kidneys 48 hours after IFN-γ challenge. Representative images shown (scale bars: 20 μm).
Figure 4
Figure 4. IONIS-APOL1Rx is an APOL1 ASO that reduces APOL1 mRNA levels in vitro and in vivo.
(A) APOL1 expression in A431 cells in vitro (n = 4) was measured by qRT-PCR after 72 hours free uptake of IONIS-APOL1Rx or control ASO and normalized to GAPDH expression. IONIS-APOL1Rx significantly reduced APOL1 expression compared with control ASO. (B) A431 cells were treated with IONIS-APOL1Rx for 72 hours by free uptake (n = 4) and expression of APOL1, APOL2, and APOL3 were measured by qRT-PCR followed by normalization to GAPDH expression. (C and D) APOL1 G0–transgenic mice were treated with IONIS-APOL1Rx 1 time per week for 4 weeks and sacrificed 48 hours after the last dose (n = 3–4). (C) Liver and kidney APOL1 expression was measured by qRT-PCR and normalized to Cyp expression. IONIS-APOL1Rx significantly reduced APOL1 mRNA expression compared with PBS control. (D) Plasma APOL1 levels were measured by ELISA and are shown relative to PBS control levels. IONIS-APOL1Rx significantly reduced plasma APOL1 compared with PBS control. All data are presented as mean ± SD. Two-way ANOVA with Bonferroni’s multiple comparisons test for A and one-way ANOVA with Dunnett’s multiple comparison’s test for C and D, *P < 0.05; ***P < 0.001.
Figure 5
Figure 5. Administration of IONIS-APOL1Rx prevents IFN-γ–induced proteinuria.
Female APOL1 G0– and G1–transgenic mice (n = 3–4) were treated with 50 mg/kg IONIS-APOL1Rx or control ASO 1 time per week for 4 weeks and challenged with a single dose of IFN-γ (1.125 × 10⁷ U/kg) or vehicle (PBS). Study endpoints were evaluated 48 hours after IFN-γ challenge. (A) Urine was collected prior to sacrifice 48 hours after IFN-γ challenge, and urinary albumin was measured by ELISA and normalized to urine creatinine. (B) Kidney Irf1 expression was measured by qRT-PCR and normalized to Cyp expression. (C) Plasma ALT levels were measured using a clinical chemistry analyzer. (D) Kidney and (E) liver APOL1 expression were measured by qRT-PCR and normalized to Cyp expression. All data are presented as mean ± SD. Two-way ANOVA with Tukey’s multiple comparisons test, *P < 0.05; **P < 0.01; ***P < 0.001. Unless otherwise indicated, similar statistical significance was achieved when comparing APOL1 ASO–treated groups challenged with PBS or IFN-γ in comparison to respective PBS- or control ASO–treated groups.
Figure 6
Figure 6. Administration of IONIS-APOL1Rx reduces kidney and plasma APOL1 protein levels.
Female APOL1 G0– and G1–transgenic mice (n = 3–4) were treated with 50 mg/kg IONIS-APOL1Rx or control ASO 1 time per week for 4 weeks and challenged with a single dose of IFN-γ (1.125 × 10⁷ U/kg) or vehicle (PBS). Study endpoints were evaluated 48 hours after IFN-γ challenge. (A) IHC analysis of APOL1 protein in kidney tissues from IONIS-APOL1Rx– or PBS-treated APOL1 G1–transgenic mice 48 hours after IFN-γ or PBS challenge. Representative images are shown (scale bar: 50 μm). (B) Plasma APOL1 levels were measured by ELISA. Data are presented as mean ± SD. Two-way ANOVA with Tukey’s multiple comparisons test, ***P < 0.001. Similar statistical significance was achieved when comparing APOL1 ASO–treated groups challenged with PBS or IFN-γ in comparison to respective PBS- or control ASO–treated groups.
Figure 7
Figure 7. IONIS-APOL1Rx reduces APOL1 mRNA expression in kidney glomerular cells.
Female APOL1 G1–transgenic mice (n = 4) were treated with PBS or 50 mg/kg IONIS-APOL1Rx 1 time per week for 4 weeks and challenged with a single dose of IFN-γ (1.125 × 10⁷ U/kg). FISH was used to evaluate APOL1 mRNA expression in podocytes (Nphs1), mesangial cells (Des), and endothelial cells (Pecam) in kidneys from IONIS-APOL1Rx– or PBS-treated APOL1 G1 mice 48 hours after IFN-γ challenge. Representative images are shown (scale bars: 20 μm).
Figure 8
Figure 8. Hepatocyte-targeted IONIS-APOL1Rx provides incomplete protection against IFN-γ–induced proteinuria.
Female APOL1 G1–transgenic mice (n = 4) were treated with IONIS-APOL1Rx, hepatocyte-targeted IONIS-APOL1Rx, or control ASO 1 time per week for 4 weeks and challenged with a single dose of IFN-γ (1.125 × 10⁷ U/kg) or vehicle (PBS). Study endpoints were evaluated 48 hours after IFN-γ challenge. (A) Kidney and (B) liver APOL1 expression were measured by qRT-PCR and normalized to Cyp expression. (C) Urine was collected prior to sacrifice 48 hours after IFN-γ challenge, and urinary albumin was measured by ELISA and normalized to urine creatinine. (D) Urinary shed cells were collected from PBS-challenged mice, and APOL1 expression was measured by qRT-PCR and normalized to 36B4/Rplp0 expression. All data are presented as mean ± SD. Statistics were performed (AC) by comparing each APOL1 ASO–treated PBS- or IFN-γ–challenged group to the respective control ASO group. Two-way ANOVA with Tukey’s multiple comparisons test, *P< 0.05; ***P < 0.001.

References

    1. Genovese G, et al. Association of trypanolytic ApoL1 variants with kidney disease in African Americans. Science. 2010;329(5993):841–845. doi: 10.1126/science.1193032. - DOI - PMC - PubMed
    1. Tzur S, et al. Missense mutations in the APOL1 gene are highly associated with end stage kidney disease risk previously attributed to the MYH9 gene. Hum Genet. 2010;128(3):345–350. doi: 10.1007/s00439-010-0861-0. - DOI - PMC - PubMed
    1. Kopp JB, et al. APOL1 genetic variants in focal segmental glomerulosclerosis and HIV-associated nephropathy. J Am Soc Nephrol. 2011;22(11):2129–2137. doi: 10.1681/ASN.2011040388. - DOI - PMC - PubMed
    1. Saran R, et al. US Renal Data System 2016 Annual Data Report: Epidemiology of Kidney Disease in the United States. Am J Kidney Dis. 2017;69(3 Suppl 1):A7–A8. - PMC - PubMed
    1. Gribouval O, et al. APOL1 risk genotype in European steroid-resistant nephrotic syndrome and/or focal segmental glomerulosclerosis patients of different African ancestries. Nephrol Dial Transplant. doi: 10.1093/ndt/gfy176. [published online ahead of print July 9, 2018]. - DOI - PubMed

Publication types