. 2019 Jun 20;4(12):e127660.
doi: 10.1172/jci.insight.127660.

Engulfment and cell motility protein 1 potentiates diabetic cardiomyopathy via Rac-dependent and Rac-independent ROS production

Affiliations

Engulfment and cell motility protein 1 potentiates diabetic cardiomyopathy via Rac-dependent and Rac-independent ROS production

Masao Kakoki et al. JCI Insight. .

Abstract

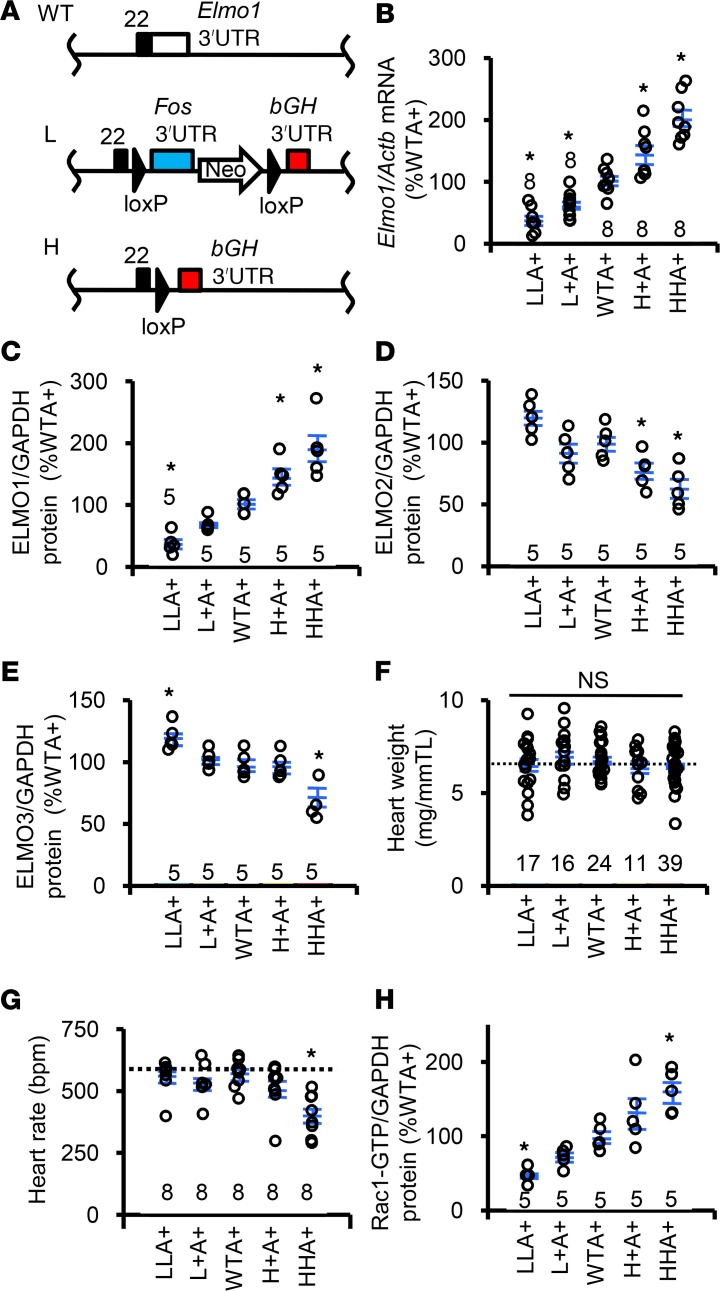
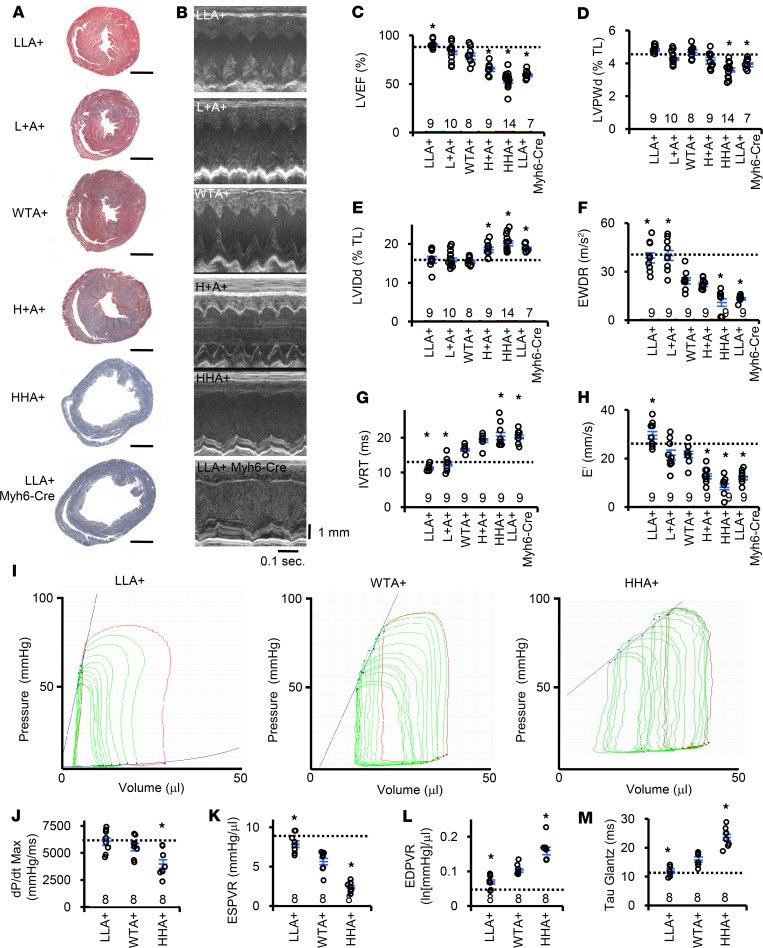
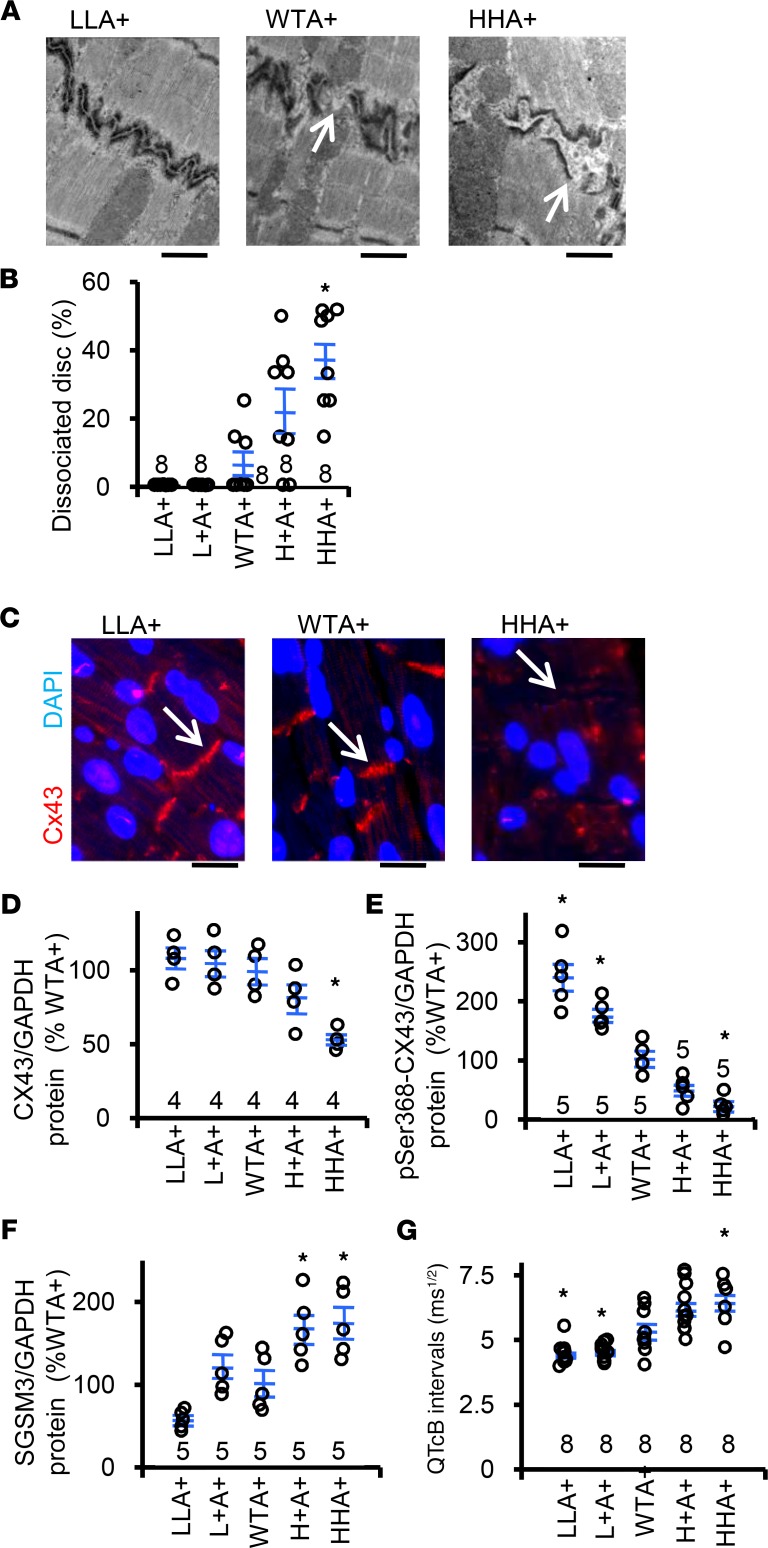
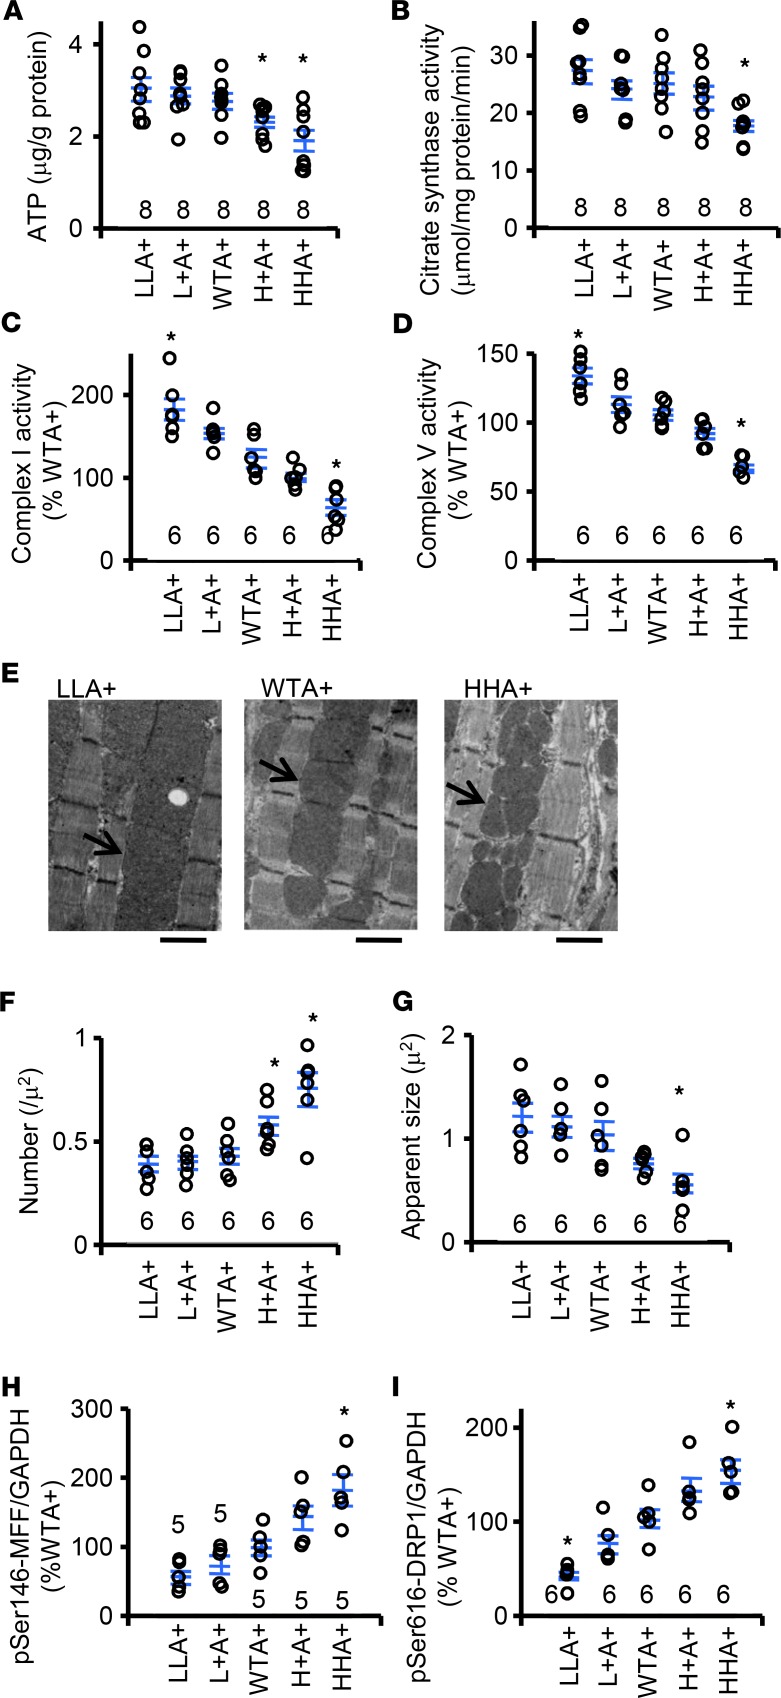
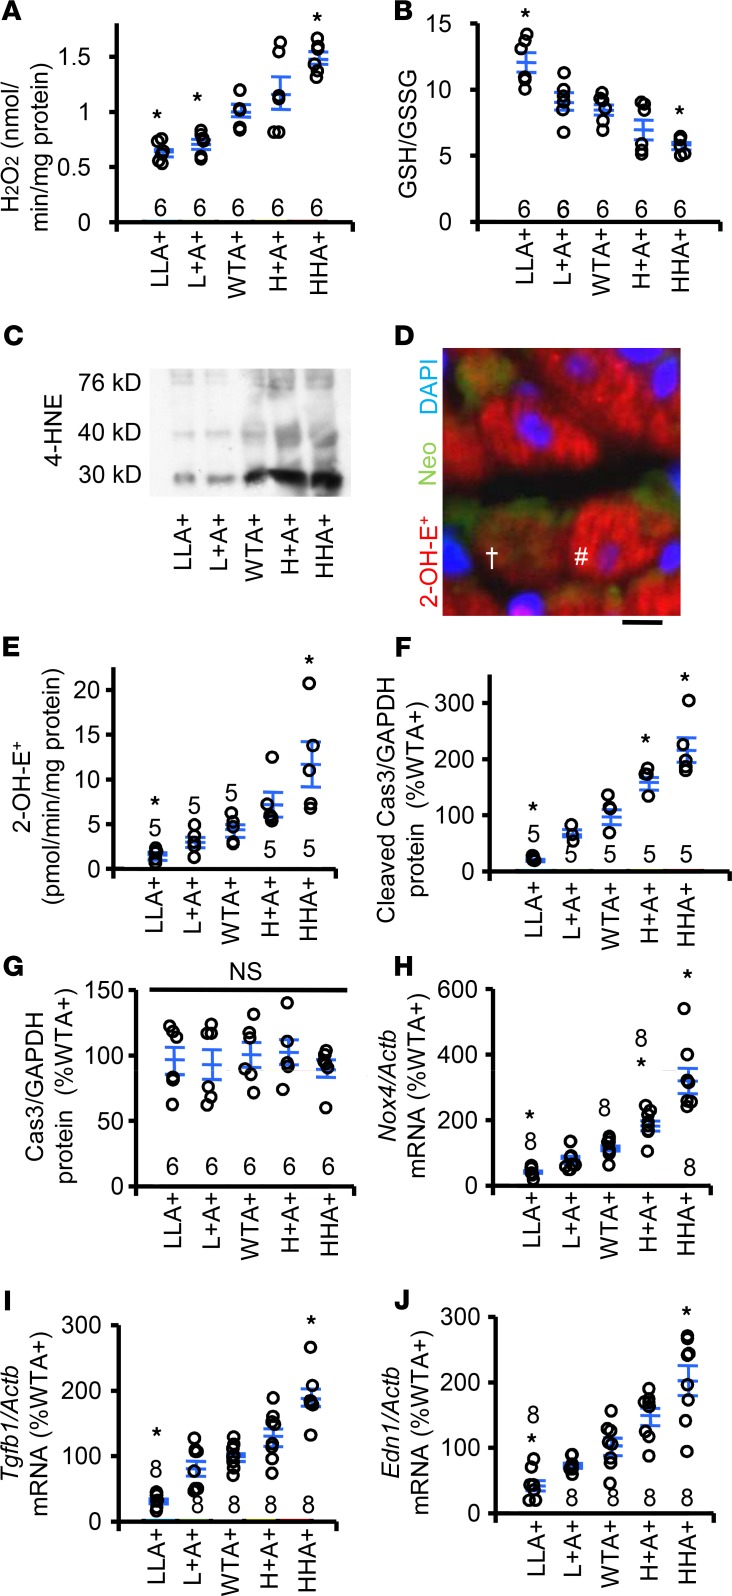
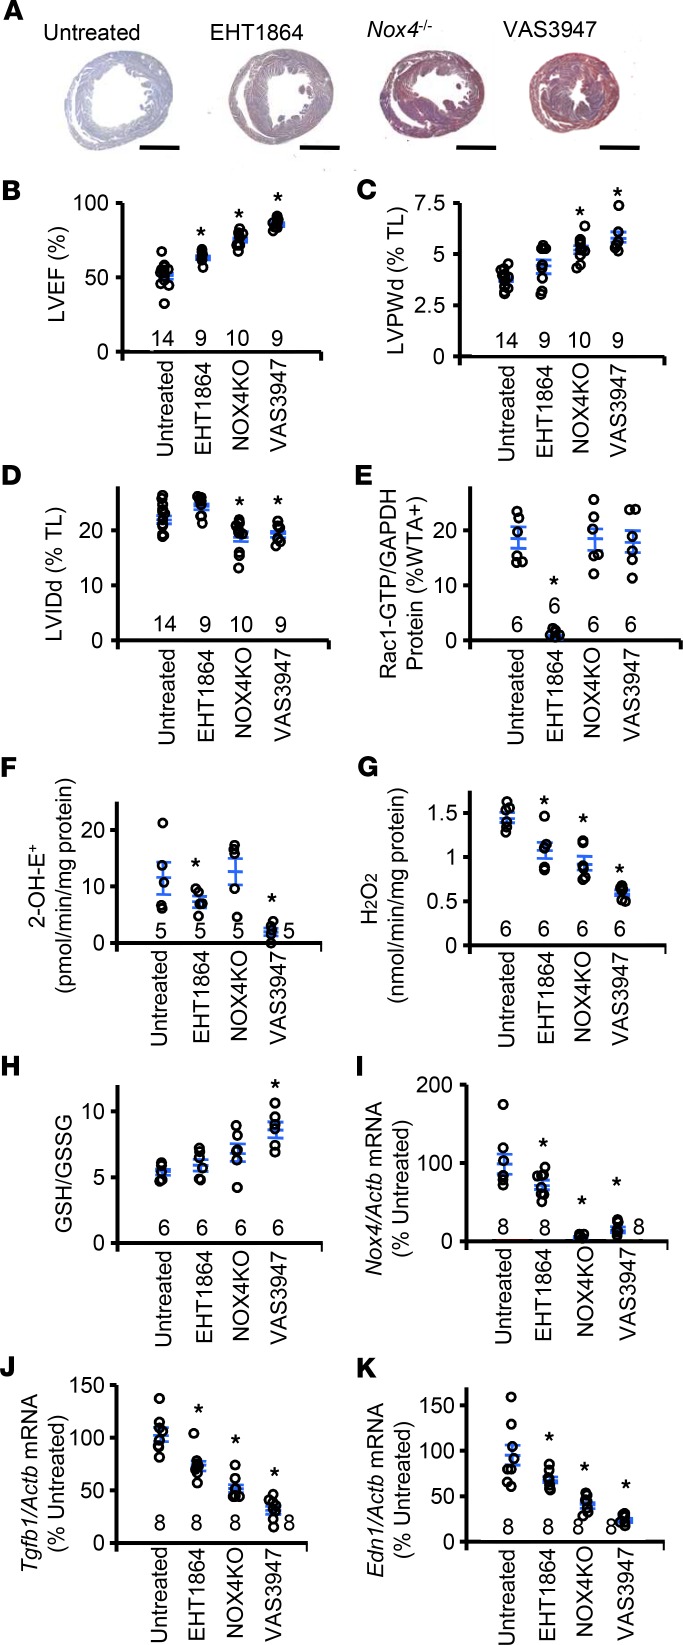
Engulfment and cell motility protein 1 (ELMO1) is part of a guanine nucleotide exchange factor for Ras-related C3 botulinum toxin substrate (Rac), and ELMO1 polymorphisms were identified to be associated with diabetic nephropathy in genome-wide association studies. We generated a set of Akita Ins2C96Y diabetic mice having 5 graded cardiac mRNA levels of ELMO1 from 30% to 200% of normal and found that severe dilated cardiomyopathy develops in ELMO1-hypermorphic mice independent of renal function at age 16 weeks, whereas ELMO1-hypomorphic mice were completely protected. As ELMO1 expression increased, reactive oxygen species indicators, dissociation of the intercalated disc, mitochondrial fragmentation/dysfunction, cleaved caspase-3 levels, and actin polymerization increased in hearts from Akita mice. Cardiomyocyte-specific overexpression in otherwise ELMO1-hypomorphic Akita mice was sufficient to promote cardiomyopathy. Cardiac Rac1 activity was positively correlated with the ELMO1 levels, and oral administration of a pan-Rac inhibitor, EHT1864, partially mitigated cardiomyopathy of the ELMO1 hypermorphs. Disrupting Nox4, a Rac-independent NADPH oxidase, also partially mitigated it. In contrast, a pan-NADPH oxidase inhibitor, VAS3947, markedly prevented cardiomyopathy. Our data demonstrate that in diabetes mellitus ELMO1 is the "rate-limiting" factor of reactive oxygen species production via both Rac-dependent and Rac-independent NADPH oxidases, which in turn trigger cellular signaling cascades toward cardiomyopathy.

Keywords: Cardiology; Cardiovascular disease.


Conflict of interest statement

Conflict of interest: The authors have declared that no conflict of interest exists.

Figures

Figure 1
Figure 1. Basic cardiac phenotypes of the Akita diabetic mice having 5 graded expression levels of Elmo1 at age 16 weeks.
LLA+, Elmo1L/L Ins2Akita/+; L+A+, Elmo1L/+ Ins2Akita/+; WTA+, Elmo1+/+ Ins2Akita/+; H+A+, Elmo1H/+ Ins2Akita/+; HHA+, Elmo1H/H Ins2Akita/+. The number of animals studied is shown in each figure. Data are expressed as mean ± SEM. Comparisons were done with ANOVA including the additional data set. *P < 0.05 vs. WTA+ mice by Tukey-Kramer Honestly Significant Differences test. NS, not significantly different among the 5 groups. (A) Top, the WT allele for Elmo1. Coding portion of the exon 22 and the endogenous 3′-UTR of Elmo1 are shown as a black box and white box, respectively. Middle, the low-expressing (L) allele. The stability of the Elmo1 mRNA is now controlled by the destabilizing 3′-UTR of Fos (blue box). Bottom, the high-expressing (H) allele. The L allele can be converted into the H allele by Cre-loxP recombination. The stability of the Elmo1 mRNA is now controlled by the stabilizing 3′-UTR of bGH (red box). (B) Cardiac Elmo1 mRNA levels normalized by mRNA of β-actin (Actb). (CE) Protein levels of ELMO1, ELMO2, and ELMO3 in each animal were normalized with the GAPDH level. (F) Heart weight normalized by tibia length (TL) and (G) heart rate. Dotted lines indicate nondiabetic WT levels. (H) Activity of Rac1 quantitated by Rac1-GTP signals.
Figure 2
Figure 2. Histology and cardiac functions with echocardiography and pressure-volume loop study.
“LLA+ Myh6-Cre” indicates LLA+ mice with the cardiomyocyte-specific Cre transgene; dotted lines indicate nondiabetic WT levels. The number of animals studied is shown in each figure. Data are expressed as mean ± SEM. Comparisons were done with 1-way ANOVA including the additional data set. *P < 0.05 vs. WTA+ mice by Tukey-Kramer Honestly Significant Differences test. (A) AZAN trichrome staining of the heart. Scale bar: 1 mm. (B) Representative M-mode echocardiograms. (C) Ejection fraction of the left ventricles (LVEF). (D) Thickness of the left ventricular posterior wall in diastole (LVPWd). Values are expressed as percentage of TL. (E) Internal diameter of the left ventricle in diastole (LVIDd) as percentage of TL. (F) E-wave deceleration rate (EWDR) of the mitral flow. (G) The isovolumic relaxation time (IVRT) of the left ventricle. (H) Early tissue Doppler velocity (E′). (I) Representative PV loops. (J) dP/dt max. (K) End-systolic pressure-volume relationship (ESPVR). (L) End-diastolic pressure-volume relationship (EDPVR). (M) Tau Glantz.
Figure 3
Figure 3. Dissociation of the intercalated disc and impaired electric conduction of heart muscle cells.
The number of animals studied is shown in each figure. Data are expressed as mean ± SEM. Comparisons were done with 1-way ANOVA including the additional data set. *P < 0.05 vs. WTA+ by Tukey-Kramer Honestly Significant Differences test. NS, not significantly different among the 5 groups. (A) Representative images of the intercalated disc in the hearts of LLA+, WTA+, and HHA+ mice as shown by TEM. White arrows indicate the dissociation of the intercalated disc. Scale bar: 1 μm. (B) Frequency of the dissociation of the intercalated disc. Percentage of discs with dissociated gap junctions per at least 30 discs in each animal. (C) Representative images for the immunofluorescence for connexin43 (Cx43). DAPI shows nuclei. The immunoreactivity for connexin43 was diminished in the intercalated discs in the HHA+ heart. Arrows indicate intercalated discs. Scale bar: 10 μm. (DF) Protein levels of (D) total connexin43, (E) Ser368-phosphorylated connexin43, and (F) small G protein signaling modulator 3 (SGSM3) were normalized with GAPDH protein and expressed relative to the mean value in the WTA+ as 100%. (G) QT intervals in the electrocardiogram after correction by RR intervals using Bazzette’s formula (QTcB).
Figure 4
Figure 4. Mitochondrial dysfunction and fragmentation.
The number of animals studied is shown in each figure. Data are expressed as mean ± SEM. Comparisons were done with 1-way ANOVA including the additional data set. *P < 0.05 vs. WTA+ mice by Tukey-Kramer Honestly Significant Differences test. NS, not significantly different among the 5 groups. (A) ATP content and (B) citrate synthase activity in the hearts of Akita mice with 5 graded expression levels of Elmo1 at 16 weeks of age. (C) Mitochondrial complex I activity. (D) Mitochondrial complex V activity. (E) Representative TEM images of the mitochondria. The fragmentation was frequently observed in the Akita mice with high expression of Elmo1. Arrows indicate mitochondria. Scale bar: 1 μm. (F) The number and (G) apparent size of mitochondria were scored from at least 30 mitochondria in each animal. (H) Relative amount of Ser146-phosphorylated mitochondrial fission factor (MFF). (I) Relative amount of Ser616-phosphorylated dynamin-related protein 1 (DRP1).
Figure 5
Figure 5. Oxidative stress in the cardiac tissue of Akita diabetic mice.
The number of animals studied is shown in each figure. Data are expressed as mean ± SEM. Comparisons were done with 1-way ANOVA including the additional data set. *P < 0.05 vs. WTA+ mice by Tukey-Kramer Honestly Significant Differences test. NS, not significantly different among the 5 groups. (A) H2O2 release. (B) Reduced glutathione (GSH) to oxidized glutathione (GSSG) ratio in the cardiac tissue in Akita diabetic mice with 5 graded expression levels of Elmo1 at 16 weeks of age. (C) An immunoblot for 4-hydroxy-2-nonenal (4-HNE). Forty micrograms of protein was applied to each lane. (D) Overlaid fluorescence of 2-hydroxyethidium (2-OH-E+) fluorescence (red), neomycin phosphotransferase II (Neo) immunoreactivity (green), and nuclei attaining with DAPI (blue) in the chimeric hearts of Elmo1L/+ Myh6-cre/Esr1 Ins2Akita/+ mice. Mice were intraperitoneally injected with low-dose tamoxifen (20 mg/kg, 2 days). The Neo-positive Elmo1L/+ cardiomyocyte (†) has a lower 2-OH-E+ fluorescence than the Neo-negative Elmo1H/+ cardiomyocyte (#). Scale bar: 10 μm. (E) Quantitation of 2-OH-E+ by HPLC. (F) Relative amount of cleaved caspase-3 (Cas3). (G) Relative amount of total caspase-3. (HJ) mRNA levels of (H) Nox4, (I) Tgfb1, and (J) Edn1. Amount of mRNA in each sample was normalized by mRNA of Actb (β-actin) and expressed relative to the mean values of WTA+ as 100%.
Figure 6
Figure 6. Effects of EHT1864 (a pan-Rac inhibitor), VAS3947 (a pan-NADPH oxidase inhibitor), and disruption of Nox4 (NOX4KO) on the hearts of Akita diabetic mice with high ELMO1 expression.
All mice were evaluated at 16 weeks of age. Oral treatments with EHT1864 or VAS3947 were given for 4 weeks. Data on the untreated HHA+ mice were taken from the previous experiments. The number of animals analyzed is given in each figure. Data are expressed as mean ± SEM. Comparisons were done with 1-way ANOVA including the additional data set. *P < 0.05 vs. untreated HHA+ mice by Tukey-Kramer Honestly Significant Differences test. NS, not significantly different among the 5 groups. (A) AZAN trichrome staining of the hearts. (B) LVEF. (C) Thickness of the LVPWd expressed as percentage of TL. (D) LVIDd expressed as percentage of TL. (E) Rac1 activity. (F) 2-OH-E+ in the cardiac tissue measured by HPLC. (G) H2O2 release. (H) GSH/GSSG ratio. (IK) mRNA levels of (I) Nox4, (J) Tgfb1, and (K) Edn1. Amount of mRNA in each sample was normalized by mRNA of Actb and expressed relative to the mean values of HHA+ mice with vehicle as 100%.

Similar articles

Cited by

References

    1. Brugnera E, et al. Unconventional Rac-GEF activity is mediated through the Dock180-ELMO complex. Nat Cell Biol. 2002;4(8):574–582. doi: 10.1038/ncb824. - DOI - PubMed
    1. Gumienny TL, et al. CED-12/ELMO, a novel member of the CrkII/Dock180/Rac pathway, is required for phagocytosis and cell migration. Cell. 2001;107(1):27–41. doi: 10.1016/S0092-8674(01)00520-7. - DOI - PubMed
    1. Shimazaki A, et al. Genetic variations in the gene encoding ELMO1 are associated with susceptibility to diabetic nephropathy. Diabetes. 2005;54(4):1171–1178. doi: 10.2337/diabetes.54.4.1171. - DOI - PubMed
    1. Pezzolesi MG, et al. Confirmation of genetic associations at ELMO1 in the GoKinD collection supports its role as a susceptibility gene in diabetic nephropathy. Diabetes. 2009;58(11):2698–2702. doi: 10.2337/db09-0641. - DOI - PMC - PubMed
    1. Craig DW, Millis MP, DiStefano JK. Genome-wide SNP genotyping study using pooled DNA to identify candidate markers mediating susceptibility to end-stage renal disease attributed to Type 1 diabetes. Diabet Med. 2009;26(11):1090–1098. doi: 10.1111/j.1464-5491.2009.02846.x. - DOI - PubMed

Publication types

MeSH terms