. 2019 Jun 19;10(1):2692.
doi: 10.1038/s41467-019-10584-4.

SMPDL3b modulates insulin receptor signaling in diabetic kidney disease

Affiliations

SMPDL3b modulates insulin receptor signaling in diabetic kidney disease

A Mitrofanova et al. Nat Commun. .

Abstract

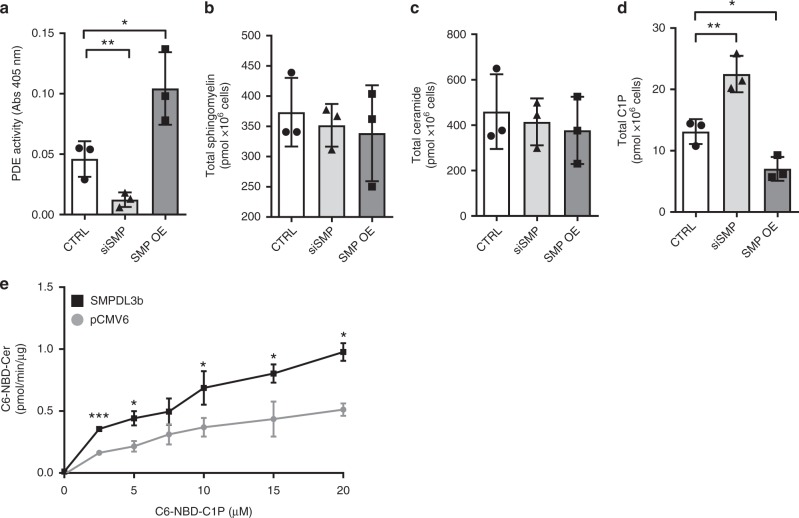
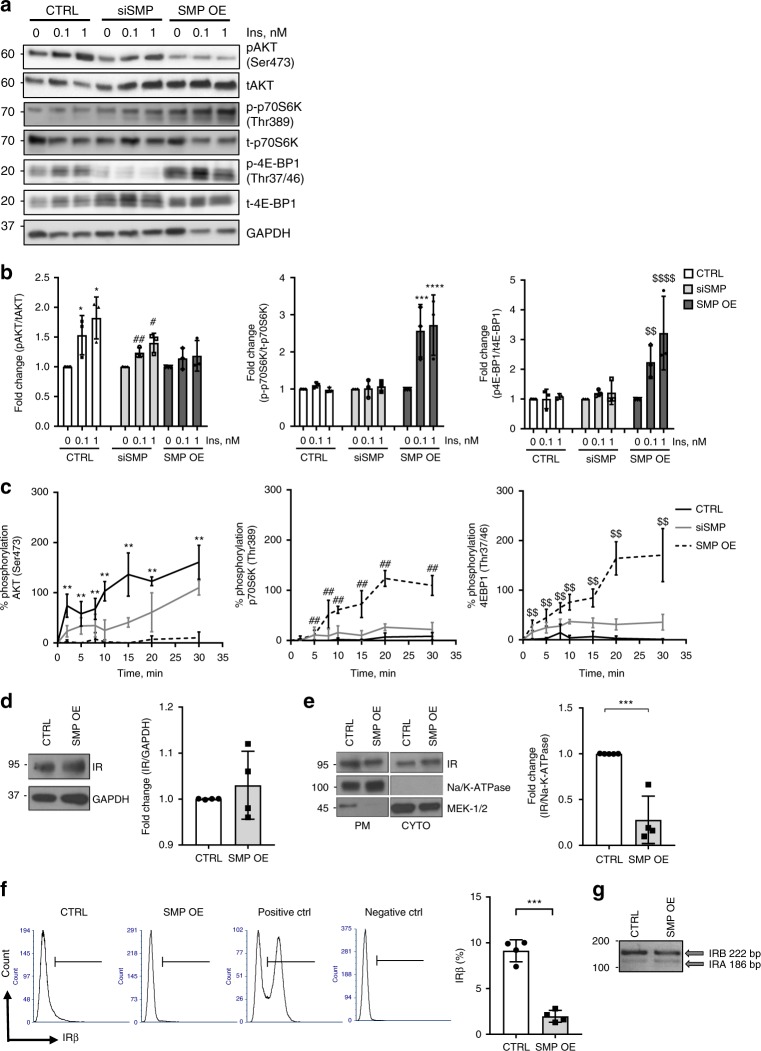
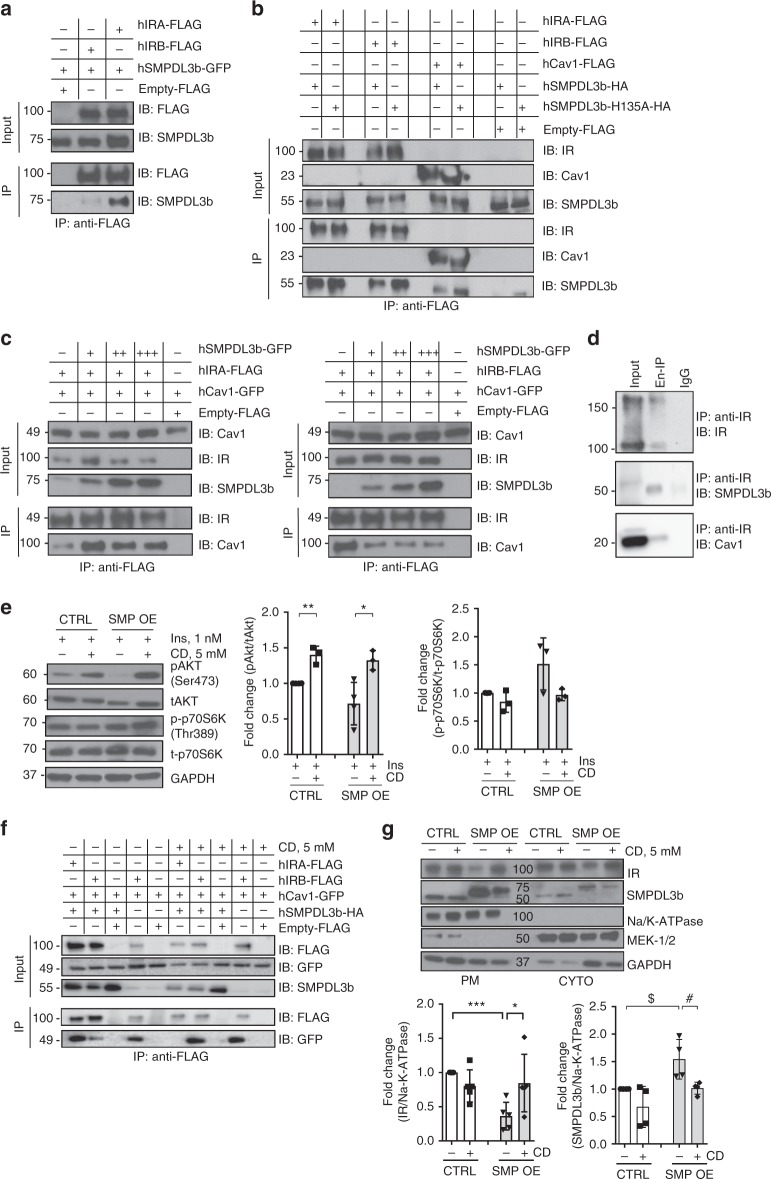
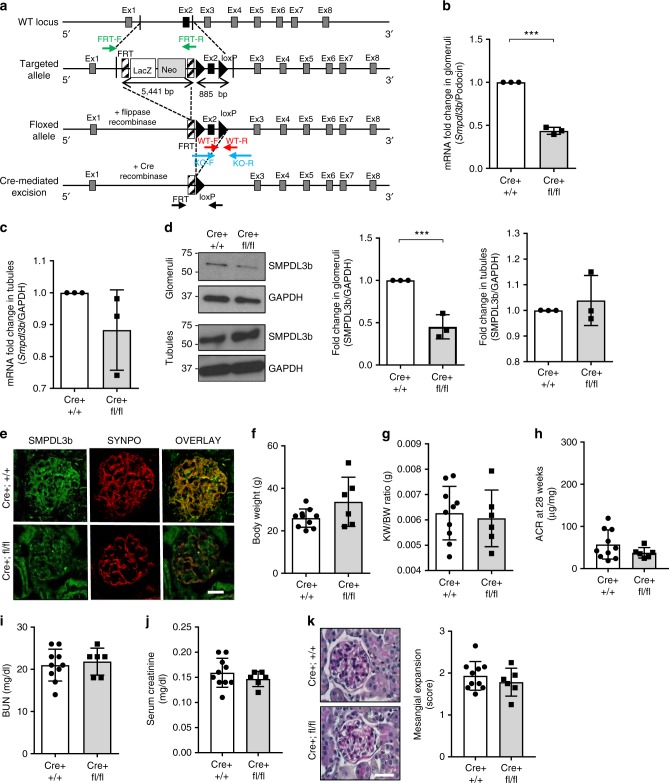
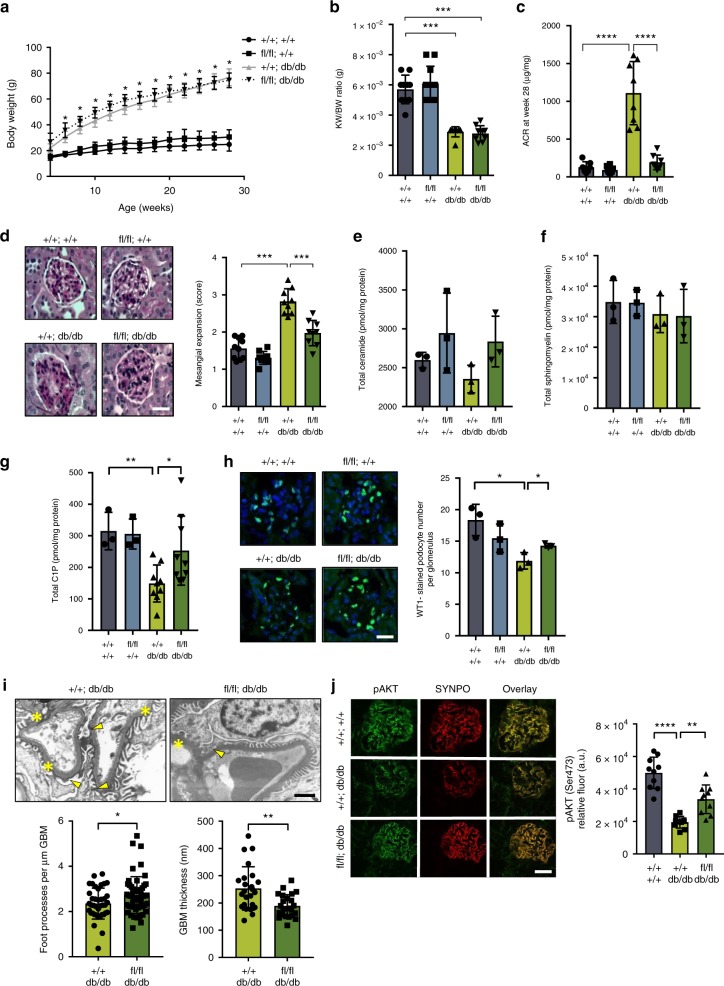
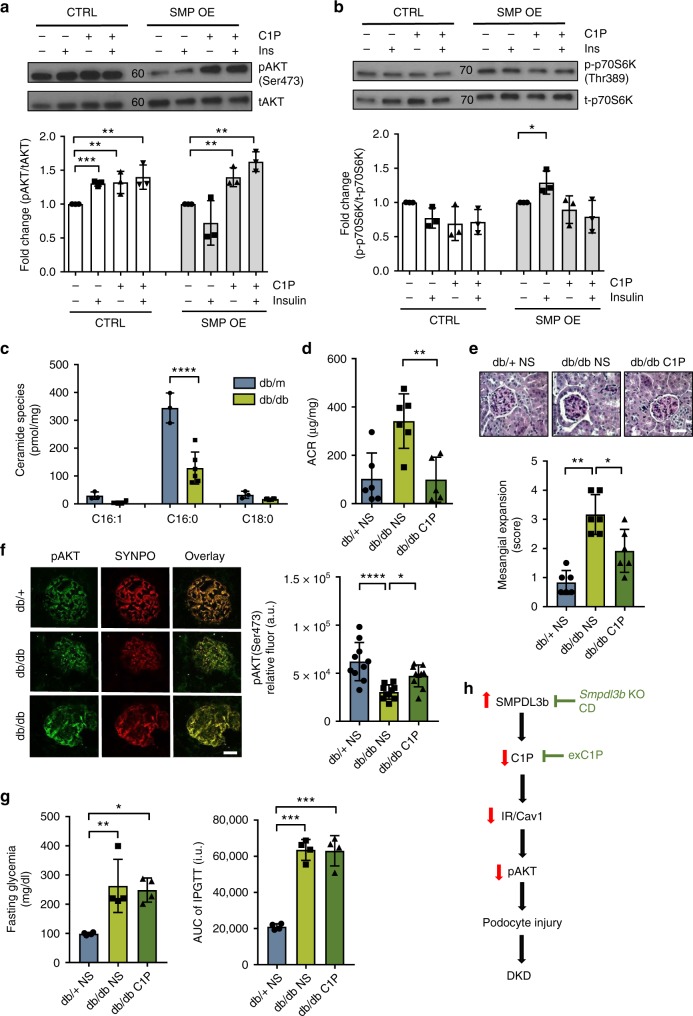
Sphingomyelin phosphodiesterase acid-like 3b (SMPDL3b) is a lipid raft enzyme that regulates plasma membrane (PM) fluidity. Here we report that SMPDL3b excess, as observed in podocytes in diabetic kidney disease (DKD), impairs insulin receptor isoform B-dependent pro-survival insulin signaling by interfering with insulin receptor isoforms binding to caveolin-1 in the PM. SMPDL3b excess affects the production of active sphingolipids resulting in decreased ceramide-1-phosphate (C1P) content as observed in human podocytes in vitro and in kidney cortexes of diabetic db/db mice in vivo. Podocyte-specific Smpdl3b deficiency in db/db mice is sufficient to restore kidney cortex C1P content and to protect from DKD. Exogenous administration of C1P restores IR signaling in vitro and prevents established DKD progression in vivo. Taken together, we identify SMPDL3b as a modulator of insulin signaling and demonstrate that supplementation with exogenous C1P may represent a lipid therapeutic strategy to treat diabetic complications such as DKD.


Conflict of interest statement

G.W.B., A.F., and S.M. are inventors on pending or issued patents (US10,183,038, US10,052,345) aimed to diagnose or treat proteinuric renal diseases. They stand to gain royalties from their future commercialization. A.F. is Chief Scientific Officer of L&F Health LLC and is consultant for Variant Pharmaceutical. Variant Pharmaceuticals, Inc. has licensed worldwide rights to develop and commercialize hydroxypropyl-beta-cyclodextrin for treatment of kidney disease from L&F Research. S.M. holds equity interest in a company presently commercializing the form of cyclodextrin referenced in this paper. The patent associated with the use of hydroxypropyl-beta-cyclodextrin is published under US10,195,227. A.F. is Chief Medical Officer of LipoNexT, LLC. The remaining authors delare no competing interests.

Figures

Fig. 1
Fig. 1
SMPDL3b affects the conversion of C1P to ceramide. a Bar graph analysis of phosphodiesterase (PDE) activity in control (CTRL), SMPDL3b knockdown (siSMP) and SMPDL3b overexpressing (SMP OE) human podocytes. n = 3 independent experiments; *P = 0.039, two-tailed t-test. b Liquid chromatography mass spectrometry analysis (LC–MS) of total sphingomyelin content in CTRL, siSMP, and SMP OE human podocytes. n = 3 independent experiments. P = 0.78, F = 0.26, one-way ANOVA. c LC–MS of total ceramide content in CTRL, siSMP, and SMP OE human podocytes. n = 3 independent experiments. P = 0.78, F = 0.78, one-way ANOVA. d LC–MS of total ceramide-1-phosphate (C1P) content in CTRL, siSMP, and SMP OE human podocytes. n = 3 independent experiments. *P = 0.045, **P = 0.007, F = 32.58, one-way ANOVA. e C1P phosphatase in vitro assay using increasing amounts C6-NBD-C1P. n = 2 independent experiments in duplicate; *P < 0.05, ***P < 0.001; two-tailed t-test. Error bars represent standard deviation (SD)
Fig. 2
Fig. 2
SMPDL3b regulates the insulin-signaling pathway in human podocytes. a Representative Western blot image of main downstream targets of the insulin receptor signaling in control (CTRL), SMPDL3b knockdown (siSMP) and SMPDL3b overexpressing (SMP OE) podocytes exposed to increasing concentration of insulin (0, 0.1, 1 nM): phosphorylated (pAKT) and total (tAKT) AKT; phosphorylated (p-p70S6K) and total (t-p70S6K) p70S6K; phosphorylated (p-4EB-P1) and total (t-4EB-P1) 4EB-P1. b Bar graph analysis of the fold change ratio of pAKT to tAKT (left panel), p-p70S6K to t-p70S6K (central panel) and p-4EB-P1 to t-4EB-P1 (right panel) in CTRL, siSMP, and SMP OE podocytes. n = 3 independent experiments; *P < 0.05 (when compared AKT phosphorylation level in insulin treated CTRL cells); ##P = 0.002, #P = 0.011, F = 5.67 (when compared AKT phosphorylation level in insulin-treated siSMP cells); ***P = 0.0002, ****P < 0.0001, F = 21.47 (when compared p70S6K phosphorylation level in insulin-treated SMP OE cells); $$P = 0.008, $$$$P < 0.0001, F = 10.09 (when compared 4EB-P1 phosphorylation level in insulin-treated SMP OE cells); one-way ANOVA. n = 3 independent experiments. c Kinetics of AKT (left panel), p70S6K (central panel), and 4EB-P1 (right panel) phosphorylation in CTRL, siSMP, and SMP OE podocytes treated with 1 nM of insulin. **P = 0.001, F = 9.31; ##P = 0.0003, F = 12.27; $$P = 0.003, F = 7.84, one-way ANOVA. n = 3. d Western blot and bar graph analysis of insulin receptor (IR) expression in total lysates of CTRL and SMP OE podocytes; P = 0.448, two-tailed t-test. n = 4 independent experiments. e Western blot and graph analysis of IR localization at the plasma membrane (PM) in CTRL and SMP OE podocytes. Na/K-ATPase was used as a marker for the PM fraction and MEK-1/2 was used as a marker of the cytosolic fraction (CYTO); ***P = 0.0004, two-tailed t-test. n = 5 independent experiments. f FACS and related quantification analysis of the insulin receptor expression in CTRL and SMP OE podocytes. Unstained cells were used as a negative control; HEK293 cells transfected with an insulin receptor overexpressing construct were served as a positive control. A total of 30,000 cells per sample was analyzed; ***P < 0.0001, two-tailed t-test. n = 4 independent experiments. g PCR analysis of the insulin receptor isoform A (IRA) and isoform B (IRB) gene expression in CTRL, and SMP OE podocytes. Error bars represent standard deviation (SD)
Fig. 3
Fig. 3
SMPDL3b interacts with IRA, IRB, and caveolin-1 in a competitive manner. ac Immunoprecipitation (IP) experiments performed in HEK293 cells co-transfected with human hIRA-FLAG, hIRB-FLAG, hSMPDL3b-GFP, hSMPDL3b-HA hSMPDL3b-H135A-HA, hCav1-FLAG, and hCav1-GFP plasmids. Empty FLAG vector (Empty-FLAG) was used as a negative control. Antibodies (IB) against FLAG, SMPDL3b, insulin receptor β-subunit (IR), or caveolin-1 (Cav1) were used in Western blot analysis. Each IP experiment was repeated at least three times. a SMPDL3b interacts with both IR isoforms but preferentially with IRA. b Wildtype SMPDL3b interacts with IRA, IRB, and caveolin-1, a mutation (H135A) in the phosphodiesterase activity domain of SMPDL3b does not affect these interactions. c Overexpression of SMPDL3b enhances the interaction between caveolin-1 and IRA (left panel) and suppresses the interaction between caveolin-1 and IRB (right panel). d Endogenous IP experiments using glomeruli isolated from five C57BL/6 mice indicate that SMPDL3b immunoprecipitates insulin receptor and caveolin-1. IgG served as a negative control. Each IP was repeated three times. e Western blot and bar graph analysis of AKT and p70S6K phosphorylation in control (CTRL) and SMPDL3b overexpressing (SMP OE) podocytes pre-treated with 5 mM methyl-β-cyclodextrin (CD) and stimulated with 1 nM insulin; *P = 0.02, **P = 0.001, two-tailed t-test. n = 3 independent experiments. f IP experiments performed in HEK293 cells co-transfected with human hIRA-FLAG, hIRB-FLAG, hCav1-GFP, and hSMPDL3b-HA show that 5 mM CD treatment abrogates IRA/Cav1 interaction and restores IRB/Cav1 interaction in presence of SMPDL3b overexpression. g Western blot and bar graph analysis of the insulin receptor (IR) and SMPDL3b localization at the plasma membrane (PM) in CTRL and SMP OE podocytes exposed to 5 mM CD for 1 h; *P = 0.049, ***P = 0.0001 (for IR); $P = 0.024, #P = 0.031 (for SMPDL3b); two-tailed t-test. n = 3 independent experiments. Error bars represent standard deviation (SD)
Fig. 4
Fig. 4
Podocyte-specific Smpdl3b-deficient mice are viable and phenotypically normal. a A schematic representation of the Smpdl3b wildtype allele and targeted locus. Ex1–8 exons 1–8; primers to detect FRT (green arrowheads), the Smpdl3b floxed allele (KO, blue arrows) and Smpdl3b wildtype allele (WT, red arrows) were used. b, c RT PCR of Smpdl3b expression in glomeruli (b) and tubules (c) pooled from five different mice; ***P = 0.003, two-tailed t-test. n = 3 independent experiments. d Western blot (left panel) and bar graph analysis of SMPDL3b expression in glomeruli (middle panel) and tubules (right panel) pooled from 2 to 5 mice per group; ***P = 0.003, two-tailed t-test. n = 3 independent experiments. e Immunostaining (40×) of SMPDL3b (green) and synaptopodin (red; SYNPO) expression in Cre+;+/+ and Cre+;fl/fl. Bar scale 30 µm. f–j Phenotypical analysis of Cre+;+/+ (n = 10 animals) and Cre+;fl/fl (n = 6 animals) 28-week-old mice. Cre+;+/+ or Cre+;fl/fl mice showed no changes in body weight (f), P = 0.076, kidney weight to body weight ratio (g), P = 0.715, urine albumin-creatinine ratio (ACR) (h), P = 0.208, blood urine nitrogen (BUN) (i), P = 0.659 and serum creatinine(j), P = 0.352; two-tailed t-test. k PAS staining (20×) of 4 μm kidney sections and bar graph analysis in Cre+;+/+ and Cre+;fl/fl mice. Bar scale 30 µm. P = 0.401, two-tailed t-test. Error bars represent standard deviation (SD)
Fig. 5
Fig. 5
Podocyte-specific Smpdl3b-deficient diabetic mice are protected from DKD. Four groups of 28 weeks-old mice were utilized: (1) wildtype mice (+/+;+/+), n = 10 animals; (2) mice with podocyte-specific Smpdl3b deficiency (fl/fl;+/+), n = 11 animals; (3) diabetic mice (+/+;db/db), n = 9 animals; (4) podocyte-specific Smpdl3b-deficient diabetic mice (fl/fl;db/db), n = 9 animals. a A graph showing body weight changes in all four groups of mice during the study. b A bar graph showing kidney to body weight (KW/BW) ratio in all four groups of mice at sacrifice time point. ***P < 0.0001, F = 44.79, one-way ANOVA. c A bar graph showing urine albumin to creatinine ratio (ACR) in all four groups of mice at sacrifice time point. ****p < 0.0001, F = 42.24, one-way ANOVA. d PAS staining (40×) of 4 μm kidney sections and bar graph analysis in all four groups of mice. Bar scale 30 µm. ****P < 0.001, F = 47.17, one-way ANOVA. eg LC–MS analysis of total ceramide (e), total sphingomyelin (f) and total ceramide-1-phosphate (g) content in kidney cortexes of all four groups of mice. P = 0.317, F = 1.38 (total ceramide), P = 0.764, F = 0.388 (total sphingomyelin), one-way ANOVA; *P = 0.023, **P = 0.002 (total ceramide-1-phosphate), two-tailed t-test. n = 3 animals per group. h Representative immunostaining (40×) for anti-Wilms’ Tumor 1 (WT1, green) and DAPI (blue) in 4 µm kidney sections of all four groups of mice. Bar scale 30 µm. *P = 0.016, **P = 0.037, two-tailed t-test. n = 3 animals per group. i Representative TEM and bar graph analysis of foot process effacement (yellow arrow) and glomerular basement membrane (GBM) thickness (yellow asterisk) in +/+;db/db and fl/fl;db/db mice. Bar scale 500 nm. *P = 0.020, **P = 0.001, two-tailed t-test. n = 3 animals per group, n = 10 micrographs analyzed per mouse. j Representative immunostaining (40×) for pAKT (Ser473) (green) and synaptopodin (red; SYNPO) in 4 µm kidney sections and bar graph analysis demonstrating increased AKT phosphorylation in all four groups of mice. Bar scale 30 µm. **P = 0.001, ****P < 0.0001, F = 37.48, one-way ANOVA. n = 3 animals per group. Error bars represent standard deviation (SD)
Fig. 6
Fig. 6
Exogenous C1P replacement restores the ability of SMPDL3b overexpressing podocytes to phosphorylate AKT and reduces albuminuria in diabetic mice. a, b Western blot and bar graph analysis of phosphorylated AKT (pAKT) to total AKT (tAKT) (a) and phosphorylated p70S6 kinase (p-p70S6K) to total p70S6 kinase (t-p70S6K) (b) in control (CTRL) and SMPDL3b overexpressing (SMP OE) human podocytes pre-treated with synthetic C1P (100 µM) and treated with insulin (1 nM); *P < 0.05, **P < 0.001, ***P < 0.0001, F = 9.66 (for AKT), F = 3.94 (for p70S6K), one-way ANOVA. n = 3 independent experiments. c LC–MS analysis of ceramide species in kidney cortexes of control mice (db/+) and diabetic mice (db/db). ****P < 0.0001, F = 27.18, two-way ANOVA. n = 3 animals per group. d For exogenous C1P administration in vivo three groups of 12-week-old mice were utilized: (1) control heterozygous mice intraperitoneally (I.P.) injected with 0.9% normal saline (db/+NS), (2) diabetic mice I.P. injected with 0.9% normal saline (db/db NS), 3) diabetic mice I.P. injected with 30 mg/kg C1P for 28 days (db/db C1P). n = 6 animals per group. A bar graph showing albumin–creatinine ratio (ACR) in db/+NS, db/db NS and db/db C1P mice. **P = 0.002, F = 10.1, one-way ANOVA. e Representative PAS staining (20×) in 4 μm kidney sections and bar graph analysis in db/+NS, db/db NS, and db/db C1P mice. Bar scale 20 µm. *P = 0.043, **P = 0.002, F = 9.47, one-way ANOVA. f Representative immunostaining (40×) for pAKT (Ser473) (green) and synaptopodin (red; SYNPO) in 4 µm kidney sections and bar graph analysis in db/+NS, db/db NS, and db/db C1P mice. Bar scale 30 µm. *P = 0.044, ****P = 0.0001, F = 8.03, one-way ANOVA. g Bar graph analysis of fasting glycemia (left panel) and area under curve of glucose tolerance test (right panel) after intraperitoneal injection of 1.5 g/kg d-glucose in db/+NS, db/db NS, and db/db C1P mice. *P = 0.013, **P = 0.008, ***P < 0.0001, F = 9.86 (for fasting glycemia), F = 67.31 (for AUC of IPGTT), one-way ANOVA. Error bars represent standard deviation (SD). h Proposed mechanism by which increased SMPDL3b expression contributes to the pathogenesis of DKD and possible targeting strategies to prevent DKD development. (↑) overexpression, (↓) suppression, CD - cyclodextrin, exC1P - exogenous C1P

Comment in

Similar articles

Cited by

References

    1. Hannun YA, Obeid LM. Principles of bioactive lipid signalling: lessons from sphingolipids. Nat. Rev. Mol. Cell Biol. 2008;9:139–150. doi: 10.1038/nrm2329. - DOI - PubMed
    1. Fornoni A, et al. Rituximab targets podocytes in recurrent focal segmental glomerulosclerosis. Sci. Transl. Med. 2011;3:85ra46. doi: 10.1126/scitranslmed.3002231. - DOI - PMC - PubMed
    1. Yoo TH, et al. Sphingomyelinase-like phosphodiesterase 3b expression levels determine podocyte injury phenotypes in glomerular disease. J. Am. Soc. Nephrol. 2015;26:133–147. doi: 10.1681/ASN.2013111213. - DOI - PMC - PubMed
    1. Heinz LX, et al. The lipid-modifying enzyme SMPDL3B negatively regulates innate immunity. Cell Rep. 2015;11:1919–1928. doi: 10.1016/j.celrep.2015.05.006. - DOI - PMC - PubMed
    1. Gorelik A, Heinz LX, Illes K, Superti-Furga G, Nagar B. Crystal structure of the acid sphingomyelinase-like phosphodiesterase SMPDL3B provides insights into determinants of substrate specificity. J. Biol. Chem. 2016;291:24054–24064. doi: 10.1074/jbc.M116.755801. - DOI - PMC - PubMed

Publication types

MeSH terms