. 2019 Jun 19;10(1):2688.
doi: 10.1038/s41467-019-10594-2.

Adenoviral vaccine targeting multiple neoantigens as strategy to eradicate large tumors combined with checkpoint blockade

Affiliations

Adenoviral vaccine targeting multiple neoantigens as strategy to eradicate large tumors combined with checkpoint blockade

Anna Morena D'Alise et al. Nat Commun. .

Abstract

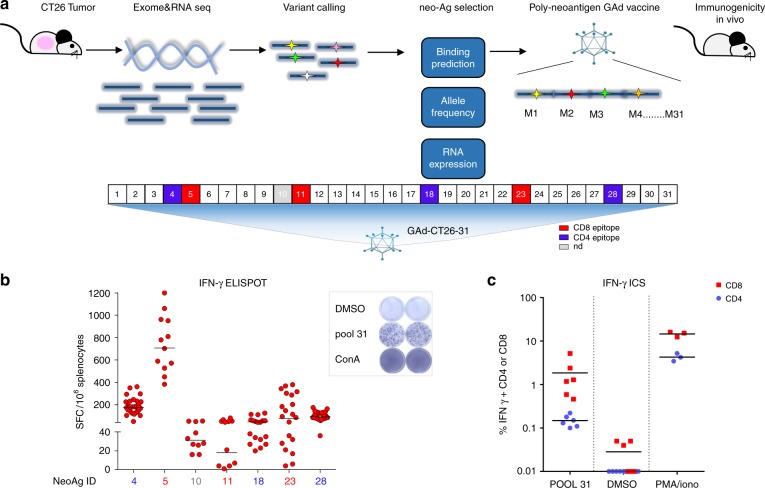
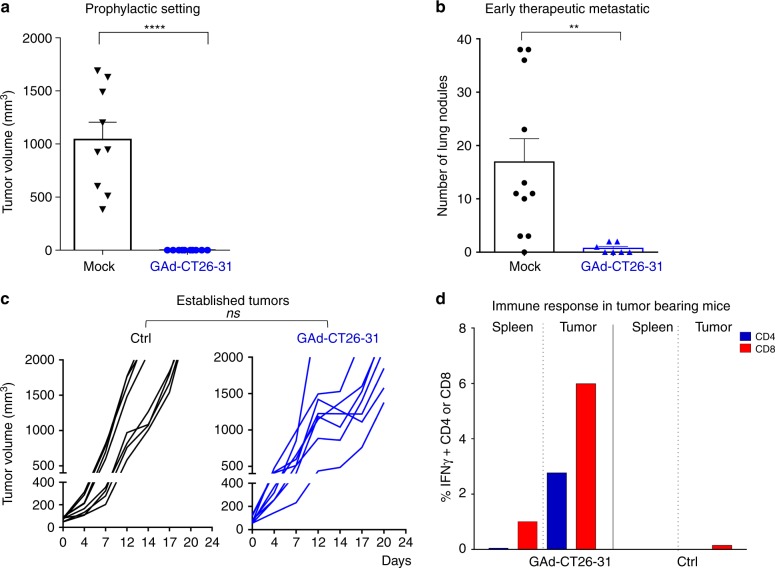
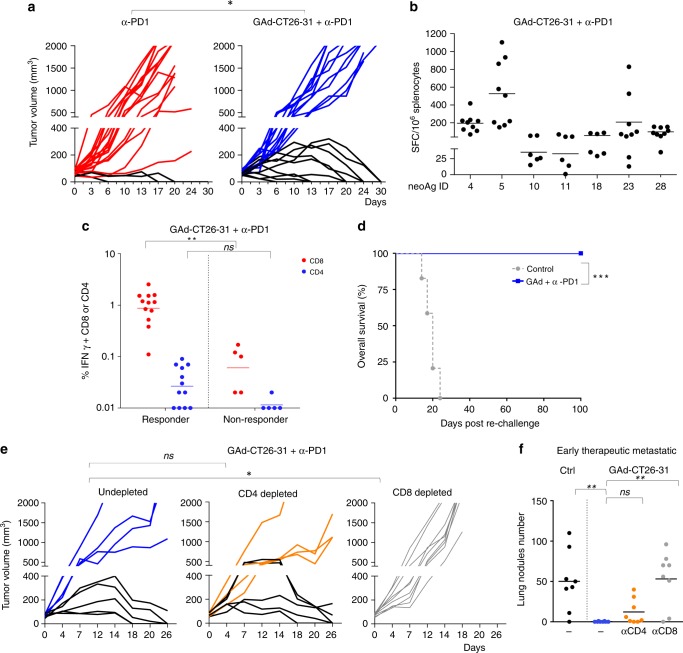
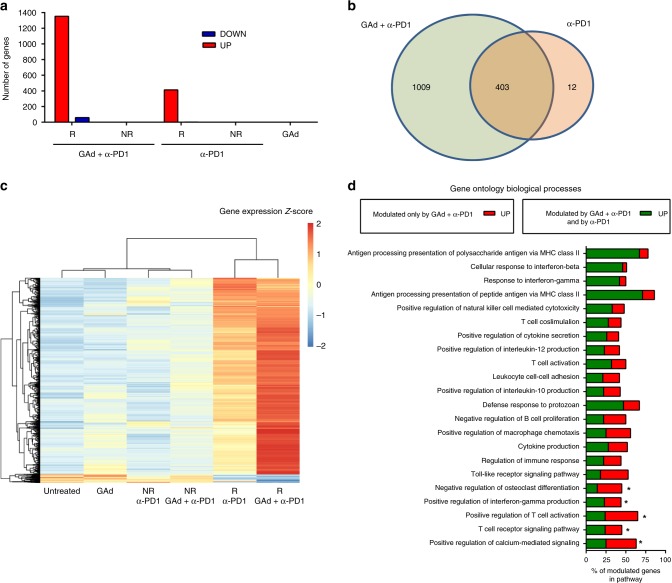
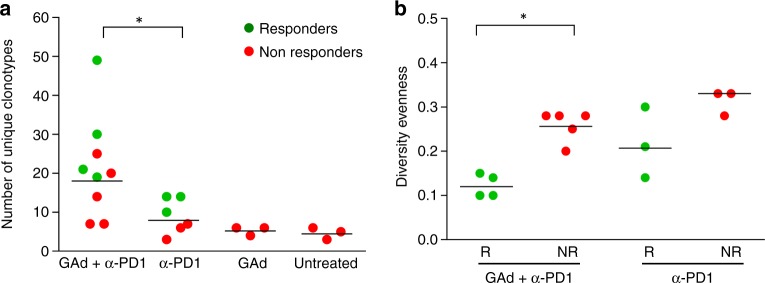
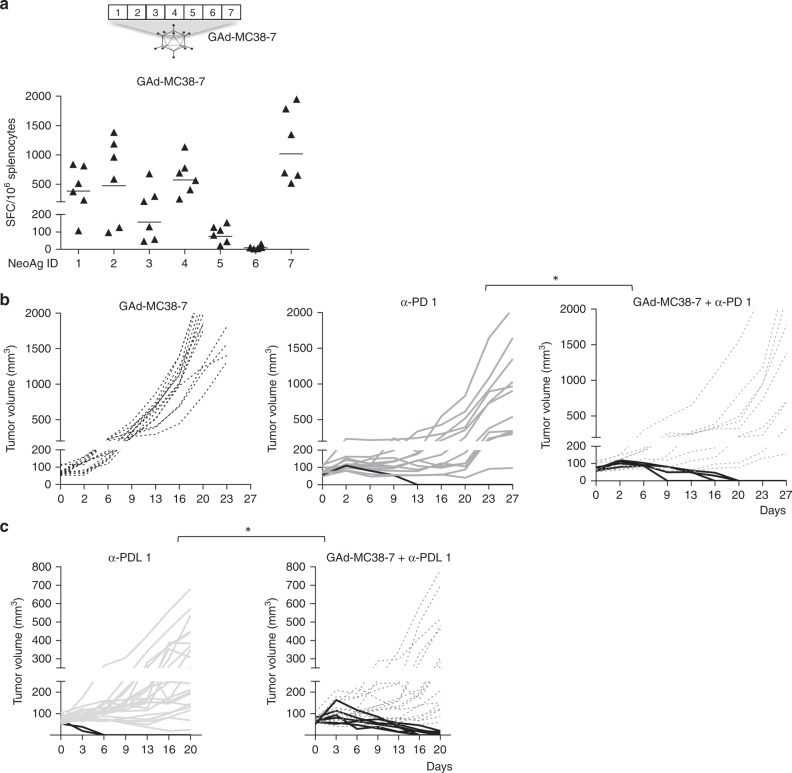
Neoantigens (nAgs) are promising tumor antigens for cancer vaccination with the potential of inducing robust and selective T cell responses. Genetic vaccines based on Adenoviruses derived from non-human Great Apes (GAd) elicit strong and effective T cell-mediated immunity in humans. Here, we investigate for the first time the potency and efficacy of a novel GAd encoding multiple neoantigens. Prophylactic or early therapeutic vaccination with GAd efficiently control tumor growth in mice. In contrast, combination of the vaccine with checkpoint inhibitors is required to eradicate large tumors. Gene expression profile of tumors in regression shows abundance of activated tumor infiltrating T cells with a more diversified TCR repertoire in animals treated with GAd and anti-PD1 compared to anti-PD1. Data suggest that effectiveness of vaccination in the presence of high tumor burden correlates with the breadth of nAgs-specific T cells and requires concomitant reversal of tumor suppression by checkpoint blockade.


Conflict of interest statement

A.N., E.S., A.F., and S.C. are founders of Nouscom. All the other authors are employees of Nouscom, except V.P., L.A., A.L., declaring no competing interests.

Figures

Fig. 1
Fig. 1
In vivo immunogenicity of GAd encoding CT26 neoantigens. a Schematic of the approach used to identify CT26 tumor specific mutations and generation of the vaccine; analysis of non-synonymous single nucleotide variants on DNA and RNA NGS allowed the selection of 31 nAgs, which were prioritized according to (i) MHC class I (predicted IC50 ≤ 500 nm) and II (binding score ≤ 1) binding predictions, (ii) tumor allele frequency (MAF ≥ 25%), and (iii) RNA expression (≥1 mutated RNA read). Selected nAgs were cloned in tandem in a GAd vector and tested in vivo. b In vivo immunogenicity of GAd-CT26-31. T-cell responses were measured by IFN-γ ELISpot on splenocytes of naive mice 3 weeks post immunization with 5 × 108vp of GAd-CT26-31 (n = 10–30 mice/group). Responses against individual nAgs peptides found immunogenic are shown; nAgs ID is in red for nAgs inducing CD8+ T-cell responses or in blue for nAgs inducing CD4+ T-cell responses. Peptide diluent DMSO and Concanavalin A were used as negative and positive control, respectively. Data are representative of three independent experiments. c The quality of induced T-cell responses (CD4, blue circles, and CD8, red squares) was assessed by IFN-γ ICS by using a pool of 31 nAgs peptides (POOL 31) (n = 6 mice/group, representative of three experiments). Peptide diluent DMSO and PMA/Ionomycin were used as negative and positive control, respectively. SFC = Spot forming cells, ConA = Concanavalin A
Fig. 2
Fig. 2
Early vaccination with GAd effectively controls tumor growth. a Mice (n = 8–10/group) were vaccinated with GAd-CT26-31; 2 weeks after immunization, CT26 cells were injected s.c. and tumor growth was monitored over time. Tumor volume measured 28 days post inoculation in GAd versus untreated (mock) mice is shown (two-tailed Mann–Whitney U test; ****p < 0.0001). b Mice (n = 8–10/group) were inoculated i.v. with CT26 cells (day 0) and left untreated (mock) or vaccinated with GAd-CT26-31 at day 3. The number of lung nodules counted at day 16 is shown (two-tailed Mann–Whitney U test; **p < 0.01). c Treatment with GAd vaccine started at day 0, on mice randomized according to tumor volume (mean 70–100 mm3, n = 8/group). Tumor volumes determined over time for individual tumors are shown. (n.s., not significant by two-tailed Mann–Whitney U test). d For analysis of immune responses in mice with established tumors, TIL or splenocytes were isolated from untreated or GAd-CT26-31-vaccinated groups and pooled (n = 4). The percentages of IFN-γ+ CD4+ or CD8+ T cells measured upon peptides pool re-stimulation are shown. Data from a to d are representative of 2–3 independent experiments
Fig. 3
Fig. 3
Efficacy of GAd in animals with high tumor burden requires the combination with anti-PD1. a Mice (n = 20/group) were inoculated s.c. with CT26 cells. One week later, animals were randomized according to tumor volume and treated with anti-PD1 alone (left panel) or in combination with GAd-CT26-31 (right panel). Vaccine was administered at day 0 (i.m.), whereas anti-PD1 was given twice per week until day 16 (i.p.). Tumor growth over time is shown for individual mice. Red and blue curves represent non-responder mice, black curves indicate responder mice. Data are from three independent experiments (two-tailed Chi-Square test; *p < 0.05). b Analysis of nAg-specific T-cell responses quantified by IFN-γ ELISpot in responder mice (splenocytes) cured by the combination of GAd and anti-PD1. Responses against the immunogenic nAgs are shown (n = 6–9 mice per group, representative of two independent experiments). c nAg-specific T-cell responses measured by IFN-γ ICS in responder and non-responder mice treated with GAd-CT26-31 and anti-PD1. Percentages of IFN-γ+ CD4+ and CD8+ T cells measured at day 30 upon peptides pool re-stimulation are shown. (two-tailed Mann–Whitney U test; **p < 0.01, n.s., not significant). d Tumor-free mice treated with anti-PD1 and GAd-CT26-31 were challenged with a second CT26 tumor inoculum (n = 10, at least three independent experiments). Animals survival after second challenge was monitored until 100 days post re-challenge. (Log-rank test; ***p < 0.001). e Tumor growth in tumor bearing mice treated with GAd-CT26-31 and anti-PD1 and depleted for CD4+ or CD8+ T cells. Data represent at least two independent experiments. (Fisher exact test; *p < 0.05). f Number of lung nodules measured in control mice or mice vaccinated with GAd-CT26-31 (n = 8 per group from one experiment) and depleted for CD4+ or CD8+ T cells (two-tailed Mann–Whitney U test; **p < 0.01; n.s., not significant)
Fig. 4
Fig. 4
Effective treatments correlate with overexpression of a large number of functionally relevant genes. a Number of differentially expressed genes (DEG) (red, upregulated; blue, downregulated) detected by RNAseq on tumors in progression (non-responders, NR) and regression (responders, R) upon anti-PD1 or anti-PD1 and vaccine combination versus untreated tumors (n = 3–5/group) (median log2 FC < −1 or >1; Benjamini–Hochberg corrected p value < 0.05). b Venn diagram showing the overlap of the DEG plotted in panel A between anti-PD1 and combination therapy. c Heat map of the 1412 DEG found in responders to the combination therapy compared to untreated for each group of treatment. d Gene Ontology (GO) enrichment analysis performed on DEG genes found in responders to GAd and anti-PD1 combination versus untreated. The 22 biological processes with at least the 40% of genes significantly modulated are shown (Bonferroni corrected p value < 0.01). Genes upregulated upon combination treatment and anti-PD1 are shown in green, those upregulated only by combination treatment are shown in red. Pathways with a significant difference in percentage of modulated genes in responders to the combo versus responders to anti-PD1 are marked with an asterisk (p < 0.05, two-tailed, Fisher test)
Fig. 5
Fig. 5
Combined treatment of GAd and anti-PD1 induced enrichment and expansion of TCR-β clonotypes: a Number of clonotypes detected in tumors (n = 3–5/group) for each group of treatment by analysis of TCR-β sequences (green circles are responder tumors, red circles non-responders). b Changes in Diversity evenness between responders (R) and non-responders (NR) to combo and anti-PD1 treatment. Diversity evenness was defined as the minimum percentage of CDR3 sequences accounting for 50% of the reads mapped on TCR-β. *p < 0.05, two-tailed Mann–Whitney U test
Fig. 6
Fig. 6
GAd and checkpoint inhibitors also synergize in the MC38 tumor model. a C57BL/6 mice (n = 6/group) were immunized with a GAd vector encoding seven MC38 neoantigens (GAd-MC38-7). Two weeks post vaccination, immune responses against the seven mutated peptides were measured on splenocytes. Data are representative of two independent experiments with six mice/group for each experiment. SFC = Spot Forming Cells. b, c Efficacy of GAd-MC38-7 alone and in combination with anti-PD1 b or anti-PDL1 c. Treatment with GAd vaccine started at day 0, on mice randomized according to tumor volume. Mice showing complete tumor shrinkage post treatment are identified by black lines. Data represent at least two independent experiments (n = 8–10/group) (Fisher test. *p <0.05)

References

    1. Hacohen N, Fritsch EF, Carter TA, Lander ES, Wu CJ. Getting personal with neoantigen-based therapeutic cancer vaccines. Cancer Immunol. Res. 2013;1:11–15. doi: 10.1158/2326-6066.CIR-13-0022. - DOI - PMC - PubMed
    1. Tran E, Robbins PF, Rosenberg SA. ‘Final common pathway’ of human cancer immunotherapy: targeting random somatic mutations. Nat. Immunol. 2017;18:255–262. doi: 10.1038/ni.3682. - DOI - PMC - PubMed
    1. Yarchoan M, Hopkins A, Jaffee EM. Tumor mutational burden and response rate to PD-1 inhibition. N. Engl. J. Med. 2017;377:2500–2501. doi: 10.1056/NEJMc1713444. - DOI - PMC - PubMed
    1. Rizvi, N. A. et al. Cancer immunology. Mutational landscape determines sensitivity to PD-1 blockade in non-small cell lung cancer. Science348, 124–128 (2015). - PMC - PubMed
    1. Yadav M, et al. Predicting immunogenic tumour mutations by combining mass spectrometry and exome sequencing. Nature. 2014;515:572–576. doi: 10.1038/nature14001. - DOI - PubMed

Publication types

MeSH terms