. 2019 Jun 19;9(1):8824.
doi: 10.1038/s41598-019-45348-z.

Propionic Acid Induces Gliosis and Neuro-inflammation through Modulation of PTEN/AKT Pathway in Autism Spectrum Disorder

Affiliations

Propionic Acid Induces Gliosis and Neuro-inflammation through Modulation of PTEN/AKT Pathway in Autism Spectrum Disorder

Latifa S Abdelli et al. Sci Rep. .

Abstract

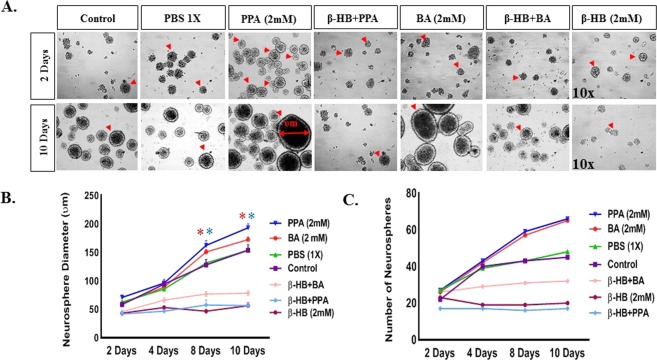
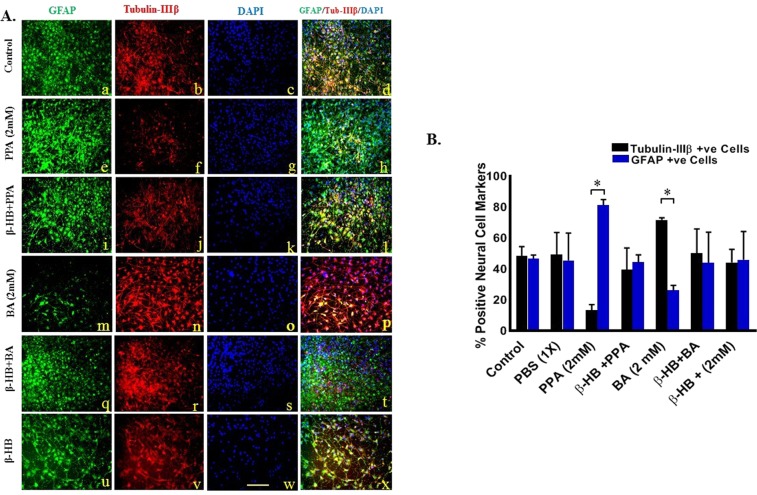
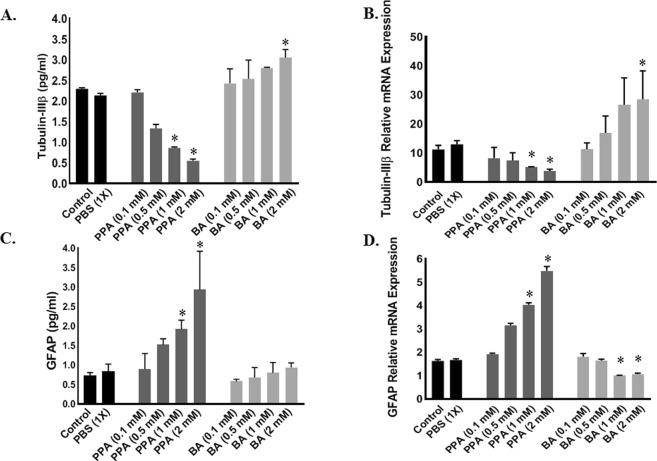
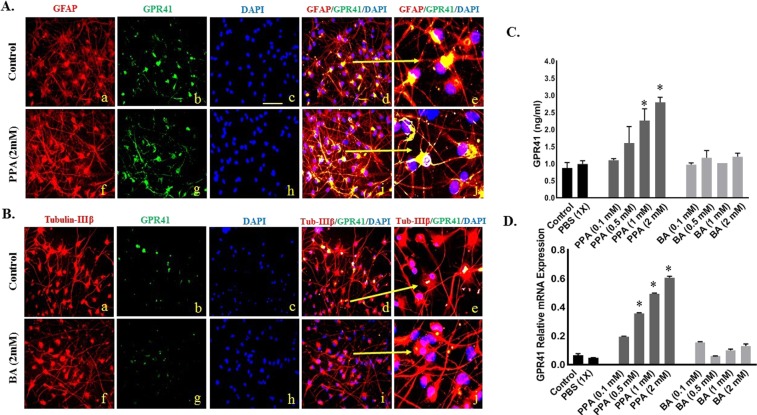
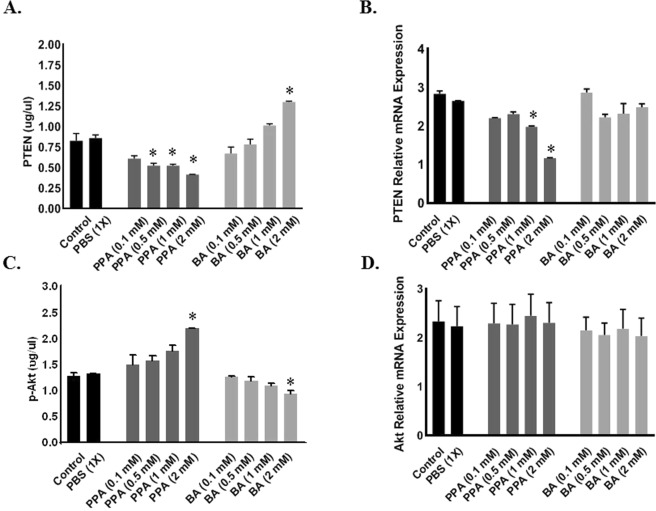
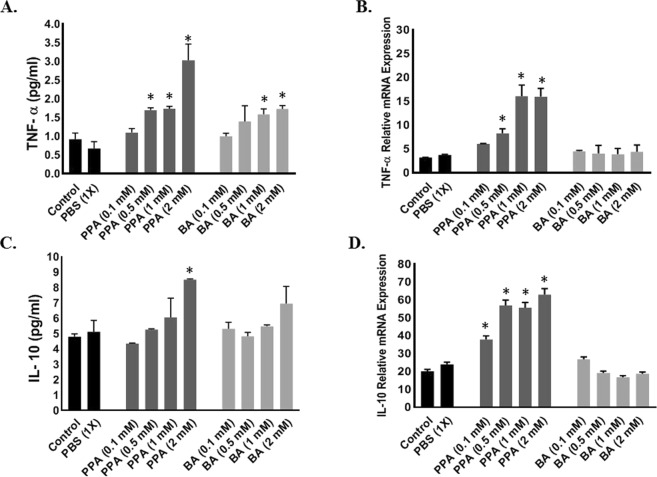
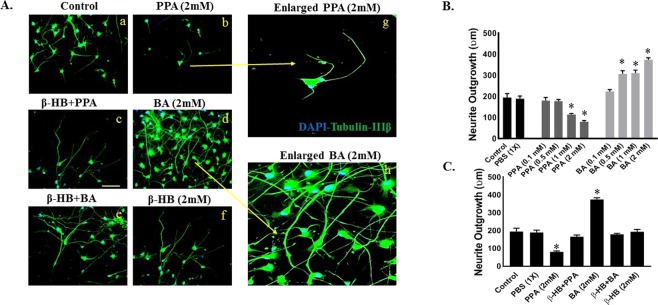
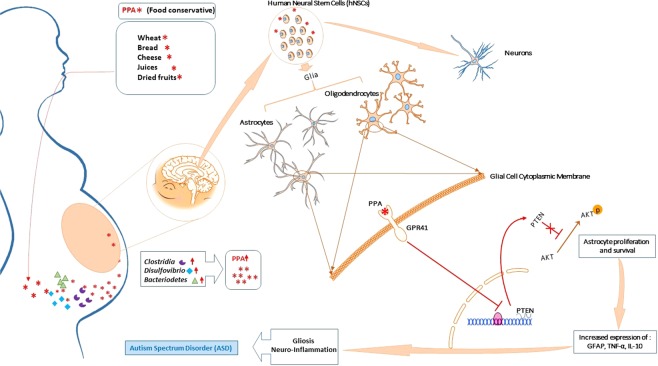
Autism spectrum disorder (ASD) is a neurodevelopmental disorder characterized by glia over-proliferation, neuro-inflammation, perturbed neural circuitry, and gastrointestinal symptoms. The role of gut dys-biosis in ASD is intriguing and should be elucidated. We investigated the effect of Propionic acid (PPA), a short-chain fatty acid (SCFA) and a product of dys-biotic ASD gut, on human neural stem cells (hNSCs) proliferation, differentiation and inflammation. hNSCs proliferated to 66 neuropsheres when exposed to PPA versus 45 in control. The neurosphere diameter also increased at day 10 post PPA treatment to (Mean: 193.47 um ± SEM: 6.673 um) versus (154.16 um ± 9.95 um) in control, p < 0.001. Pre-treatment with β-HB, SCFA receptor inhibitor, hindered neurosphere expansion (p < 0.001). While hNSCs spontaneously differentiated to (48.38% ± 6.08%) neurons (Tubulin-IIIβ positive) and (46.63% ± 2.5%) glia (GFAP positive), PPA treatment drastically shifted differentiation to 80% GFAP cells (p < 0.05). Following 2 mM PPA exposure, TNF-α transcription increased 4.98 fold and the cytokine increased 3.29 fold compared to control (P < 0.001). Likewise, GPR41 (PPA receptor) and pro-survival p-Akt protein were elevated (p < 0.001). PTEN (Akt inhibitor) level decreased to (0.42 ug/ul ± 0.04 ug/ul) at 2 mM PPA compared to (0.83 ug/ul ± 0.09 ug/ul) in control (p < 0.001). PPA at 2 mM decreased neurite outgrowth to (80.70 um ± 5.5 um) compared to (194.93 um ± 19.7 um) in control. Clearly, the data supports a significant role for PPA in modulating hNSC patterning leading to gliosis, disturbed neuro-circuitry, and inflammatory response as seen in ASD.


Conflict of interest statement

The authors declare no competing interests.

Figures

Figure 1
Figure 1
SCFAs Enhance Neural Stem Cell Proliferation In Vitro. Panel A depicts 10x representative bright field representative images of neurospheres at day 2 and 10 for the following treatments; Control, PBS (1X), PPA (2 mM), β-HB + PPA, BA (2 mM), β-HB + BA, and β-HB alone. Red arrows are pointing towards neurospheres. Graph 1B represents quantitative data for neurosphere diameter (um) averages per treatment group over day 2, 4, 8, and 10. Graph 1C depicts number of neurospheres averages per treatment group over day 2, 4, 8, and 10. Data is represented as Mean + SEM (n > 10 neurospheres per group and time setting) and statistical significance: *p < 0.0001, F (6, 286) = 48.71 (Wilcoxon matched-pairs and One-way ANOVA followed by Tukey’s post-hoc test). Red and blue (*) represent significance of the corresponding color treatment vs. its Control.
Figure 2
Figure 2
PPA Promotes Glial Cells Differentiation In Vitro. (A) Depicts fluorescent representative images of differentiated cells from hNSCs with green color for GFAP positive cells (a,e,I,m,q, and u), red for Tubulin-IIIβ positive cells (b,f,j,n,r, and v), blue color for DAPI positive cells (c,g,k,o,s, and w), and merged images of all three channels per treatment in (d,h,l,p,t, and x) for Control, PPA (2 mM), β-HB + PPA, BA (2 mM), β-HB + BA, and β-HB treatments, respectively. Magnification 25x and scale bar 25 um. (B) Represents quantitative analysis of the Mean of % positive neural cell markers over total DAPI with black bars for Tubulin-IIIβ positive, and blue bars for GFAP positive cells. Data was collected from a minimum of (n = 3) random areas per duplicated treatment setting. Statistical significance was tested using One-way ANOVA followed by Tukey and confirmed with Wilcoxon matched-pairs tests. (*p < 0.05, F (13, 28) = 2.520), for GFAP vs Tubulin-IIIβ positive cells within the ([) limited treatments.
Figure 3
Figure 3
Effect of PPA on Neural versus Glial Cell Markers. Depicts; ELISA (A,C) and RT-PCR (B,D) analysis for Tubulin-IIIβ (A,B) and GFAP (C,D) under ascending concentrations of PPA and BA (0.1, 0.5, 1, and 2 mM). Black bars represent the controls (no treatment other than media) and media supplemented with 1x PBS. Data is represented as Mean + SEM (n = 3 per group) and statistical significance (*p < 0.0001 for Tubulin-IIIβ and p < 0.05 for GFAP) was obtained using either (Two-tailed Unpaired t test, Wilcoxon matched-pairs, and/or One-way ANOVA followed by Tukey’s post-hoc test) vs. Controls.
Figure 4
Figure 4
GPR41 Expression Pattern on Neurons versus Glial Cells. Panel A and B depicts double-immunostained representative images of differentiated cells double positive for GFAP + GPR41 (panel A) and Tubulin-IIIβ + GPR41 (panel B). GFAP and Tubulin-IIIβ stainings are depicted in red (a,f) in panels A and B, respectively. GPR41 is depicted in green (B,C), and DAPI in blue (C,H). Merged a + b + c channels are depicted in (d) and enlarged in (e) for control merged f + g + h channels in (i) and enlarged in (j) for PPA 2 mM treated cells (Panel A and BA treated cells for panel B). Magnification 25x and scale bar 25 um. (C,D) Represent ELISA and RT-PCR results for GPR41 expression under ascending concentrations of PPA and BA (0.1, 0.5, 1, and 2 mM). Black bars present the controls (no treatment other than media) and media supplemented with 1x PBS. Data is represented as Mean + SEM (n = 3 replicates per group) and statistical significance (*P < 0.0001, F (9, 10) = 718.4) was calculated using Wilcoxon matched-pairs and One-way ANOVA followed by Tukey’s post-hoc test vs. Controls.
Figure 5
Figure 5
PPA Induces GPR41-Mediated p-Akt Survival Pathway in Differentiating Glial Cells. Depicts; ELISA (A,C) and RT-PCR (B,D) analysis for PTEN (A,B) and p-Akt/Akt (C,D) under ascending concentrations of PPA and BA (0.1, 0.5, 1, and 2 mM). Black bars represent the controls (no treatment other than media) and media supplemented with 1x PBS. Data is represented as Mean + SEM (n = 3 per group) and statistical significance: (*p < 0.001 for PTEN and p < 0.05 for p-Akt) was calculated using One-way ANOVA followed by Tukey’s post-hoc tests vs. Controls.
Figure 6
Figure 6
PPA-Induced Glial Activation, Promotes Inflammation. Depicts; ELISA (A,C) and RT-PCR (B,D) analysis for pro-inflammatory TNF-α (A,B) and Anti-inflammatory IL-10 (C,D) under ascending concentrations of PPA and BA (0.1, 0.5, 1, and 2 mM). Black bars represent the controls (no treatment other than media) and media supplemented with 1x PBS. Data is represented as Mean + SEM (n = 3 per group) and statistical significance (*p < 0.001 for TNF-α and p < 0.05 for IL-10) was calculated using One-way ANOVA followed by Tukey’s post-hoc tests vs. Controls.
Figure 7
Figure 7
The Bivalent Role of PPA and BA on Neurite Growth In Vitro. Panel A(a–f) depicts double-immunostained representative images of differentiated neurons labeled with Tubulin-IIIβ and DAPI. Images (g,h) are enlarged views of (b,f), respectively. Magnification 25x and scale bar 25 um. Histogram B depict quantitative analysis of neurite outgrowth in (um) under control, PBS (1x), PPA (0.1, 0.5, 1, and 2 mM) and BA (0.1, 0.5, 1, and 2 mM). Histogram C depicts neurite outgrowth measurements in presence or absence of β-HB pre-treatment. Data is represented as Mean+SEM (n = 15 neurites per group) and statistical significance: (*p < 0.0001, F (10, 111) = 53.15) versus controls was obtained using Wilcoxon matched-pairs and One-way ANOVA followed by Tukey post-hoc test.
Figure 8
Figure 8
Overall Diagram for Hypothesized PPA Effect on hNSC in vitro. During the early stages of pregnancy, increased consumption of PPA-rich processed foods combined with pre-existent dysbiosis may lead to accumulation of PPA in the maternal GI, travel through general circulation, cross the placental barrier, and interfere with neural differentiation through binding to GPR41 receptor preferably expressed on glial progenitor cells. This will activate a downstream molecular pathway resulting in PTEN inhibition and activation of pro-survival Akt pathway, therefore favoring glial progenitor cells proliferation and differentiation. Mature glial cells will move on to produce inflammatory cytokines and release GFAP, all of which mimic gliosis and neuro-inflammation observed in ASD. Some illustrations used in this figure were originated from leased Motifolio (Scientific Illustration Toolkits for Presentations and Publications) materials.

References

    1. American Psychiatric Association. Diagnostic and Statistical Manual of Mental Disorders: DSM-IV. (American Psychiatric Pub, 2013).
    1. Reichow, B., Barton, E. E., Boyd, B. A. & Hume, K. Early intensive behavioral intervention (EIBI) for young children with autism spectrum disorders (ASD). Cochrane Database of Systematic Reviews. 10 (2012). - PubMed
    1. Baio J, et al. Prevalence of Autism Spectrum Disorder Among Children Aged 8 Years — Autism and Developmental Disabilities Monitoring Network, 11 Sites, United States, 2014. MMWR. Surveillance Summaries. 2018;67:1–23. doi: 10.15585/mmwr.ss6706a1. - DOI - PMC - PubMed
    1. Altowairqi W, Alosaimi W, Alzaidi S, Helmy F, Alsherif E. Depression among mothers of autistic spectral disorder children. International Journal of Contemporary Pediatrics. 2015;2:119. doi: 10.5455/2349-3291.ijcp20150511. - DOI
    1. Abrahams BS, et al. SFARI Gene 2.0: a community-driven knowledgebase for the autism spectrum disorders (ASDs) Molecular Autism. 2013;4:36. doi: 10.1186/2040-2392-4-36. - DOI - PMC - PubMed

Publication types

MeSH terms