. 2019 Jul;571(7765):403-407.
doi: 10.1038/s41586-019-1311-3. Epub 2019 Jun 19.

Distinct modes of mitochondrial metabolism uncouple T cell differentiation and function

Affiliations

Distinct modes of mitochondrial metabolism uncouple T cell differentiation and function

Will Bailis et al. Nature. 2019 Jul.

Erratum in

Abstract

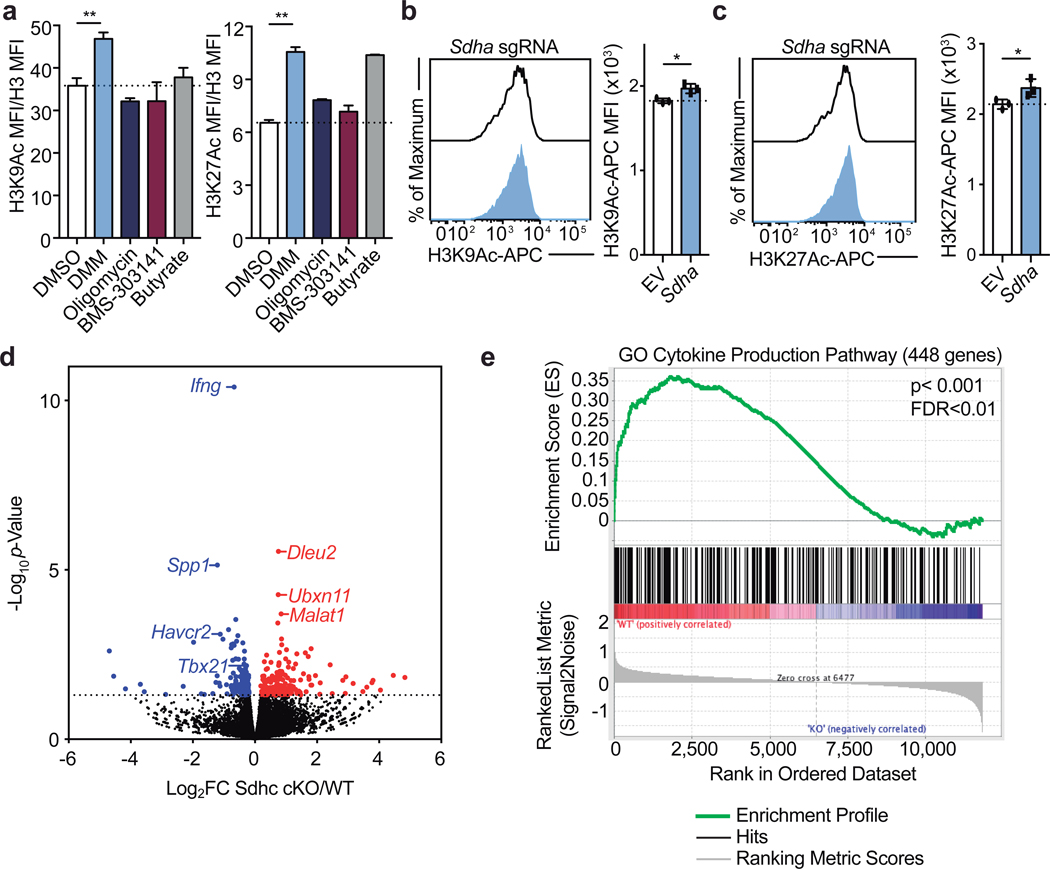
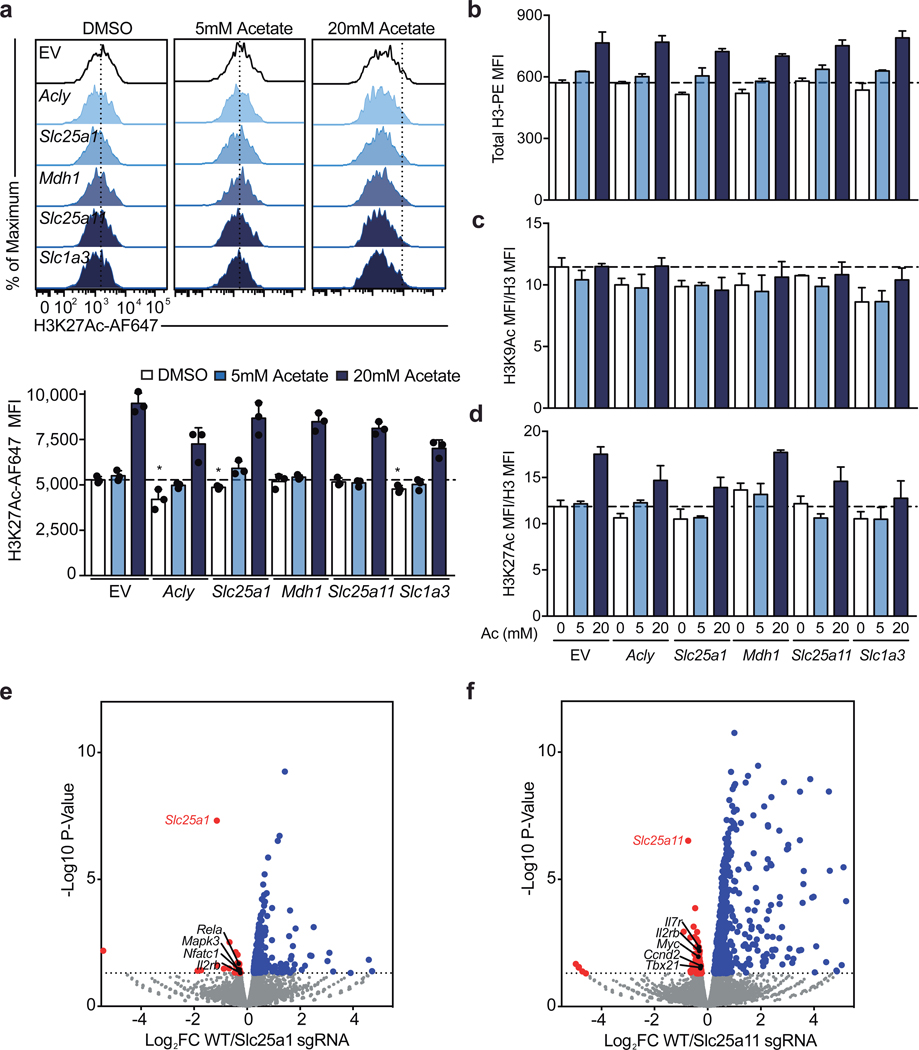
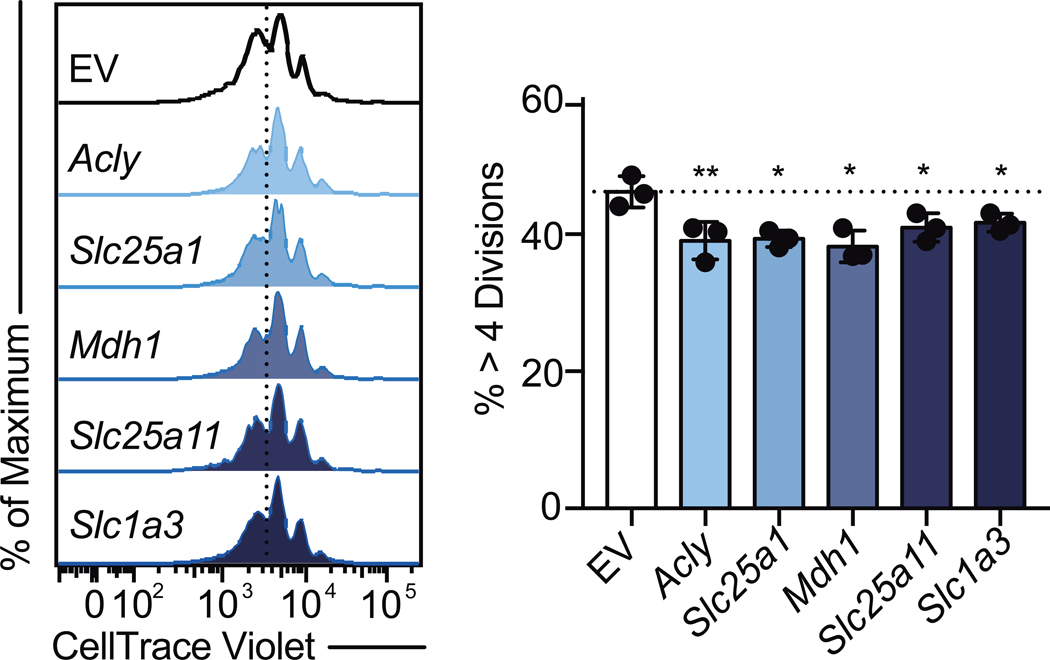
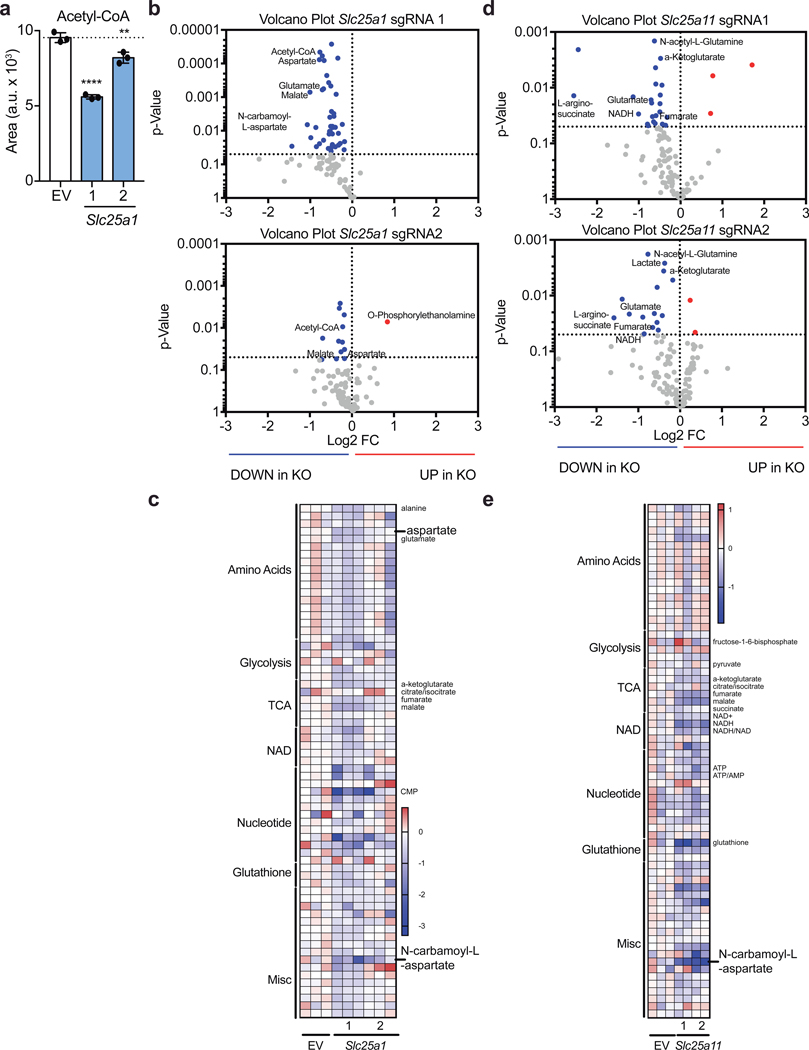
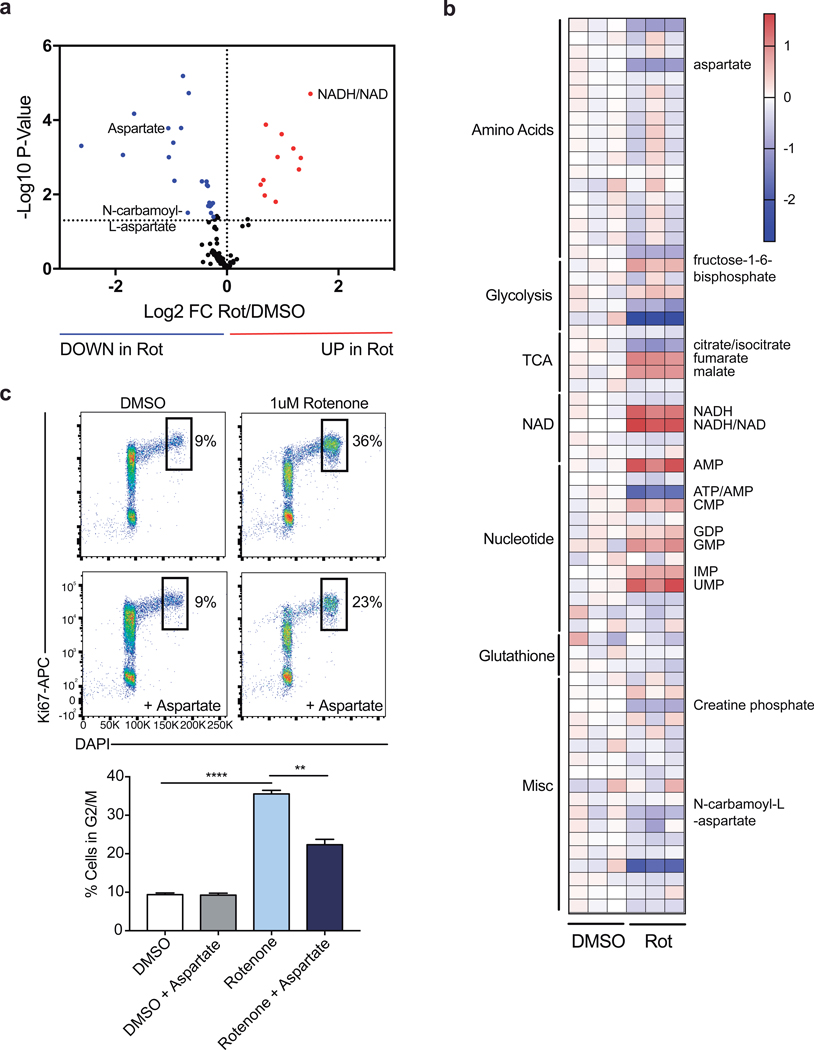
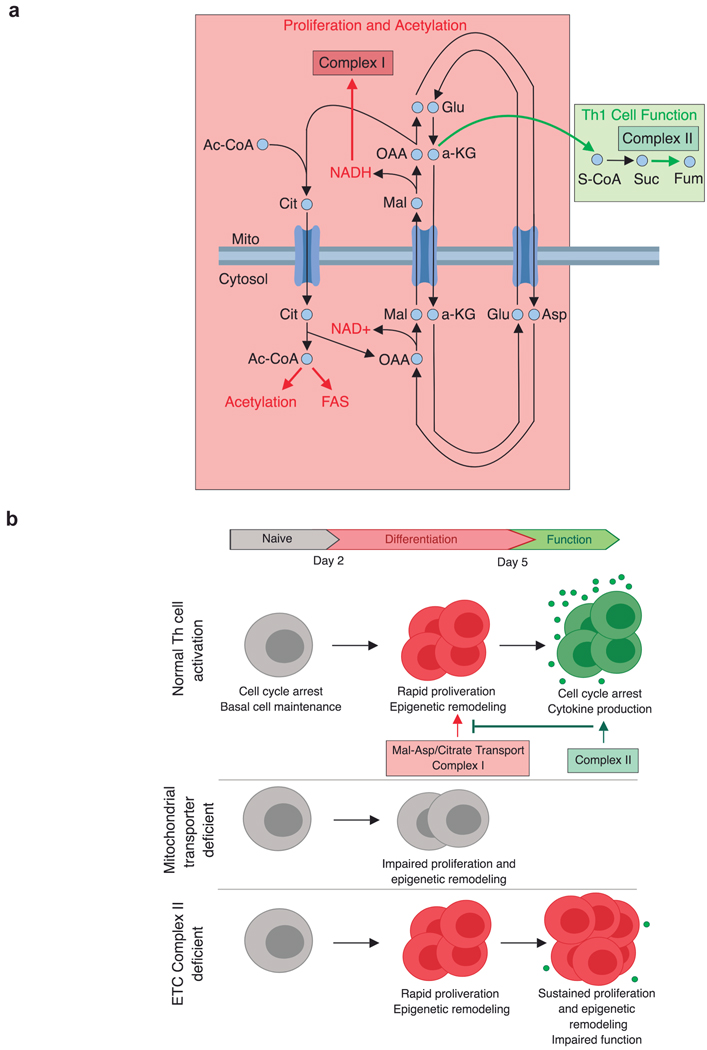
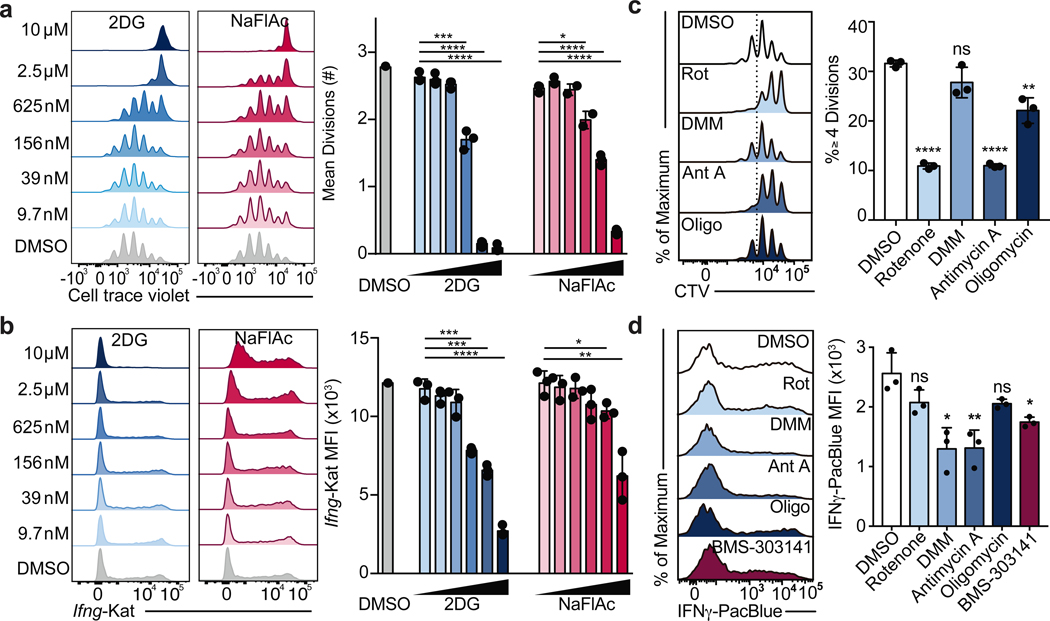
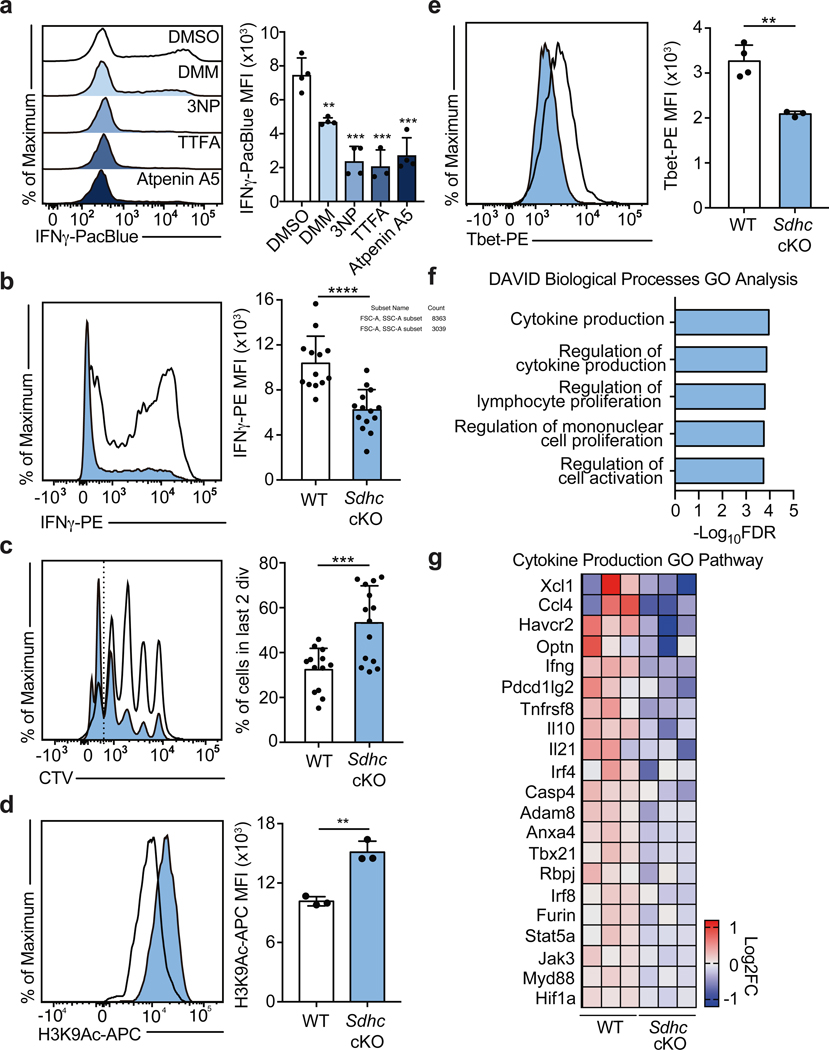
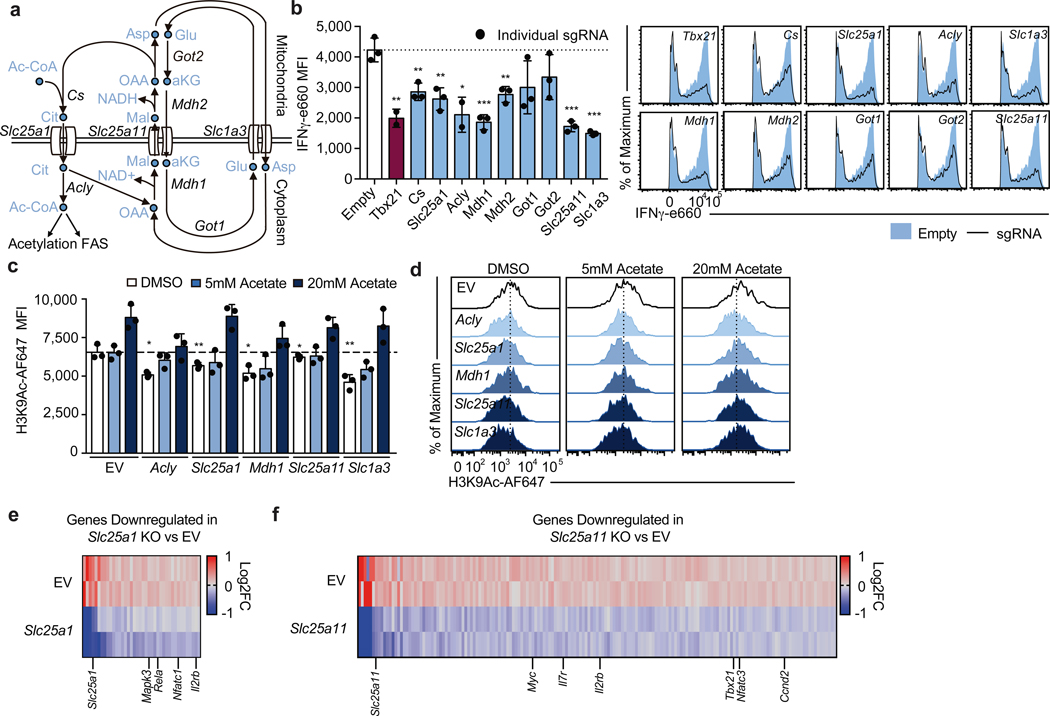
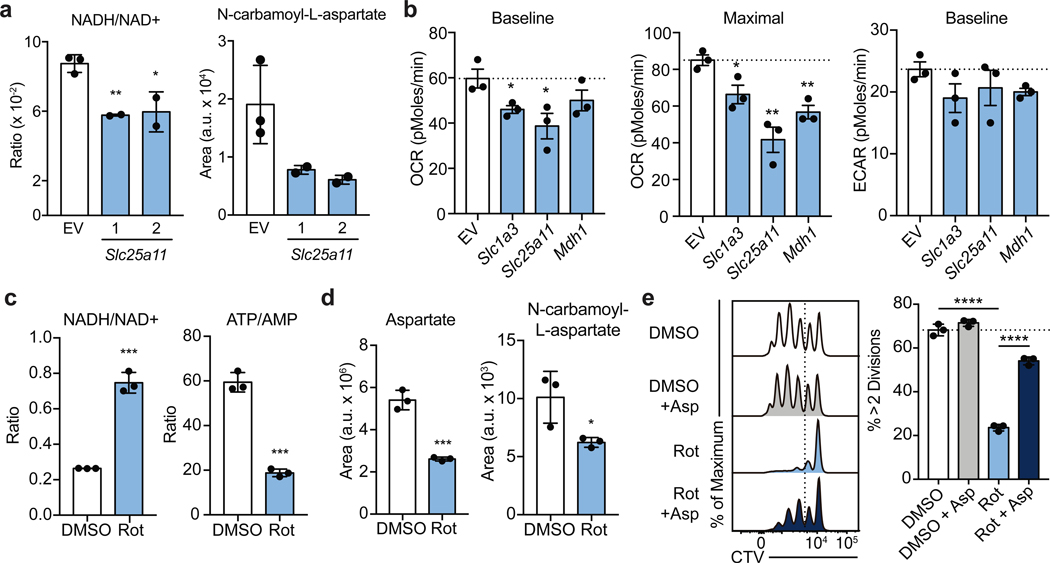
Activated CD4 T cells proliferate rapidly and remodel epigenetically before exiting the cell cycle and engaging acquired effector functions. Metabolic reprogramming from the naive state is required throughout these phases of activation1. In CD4 T cells, T-cell-receptor ligation-along with co-stimulatory and cytokine signals-induces a glycolytic anabolic program that is required for biomass generation, rapid proliferation and effector function2. CD4 T cell differentiation (proliferation and epigenetic remodelling) and function are orchestrated coordinately by signal transduction and transcriptional remodelling. However, it remains unclear whether these processes are regulated independently of one another by cellular biochemical composition. Here we demonstrate that distinct modes of mitochondrial metabolism support differentiation and effector functions of mouse T helper 1 (TH1) cells by biochemically uncoupling these two processes. We find that the tricarboxylic acid cycle is required for the terminal effector function of TH1 cells through succinate dehydrogenase (complex II), but that the activity of succinate dehydrogenase suppresses TH1 cell proliferation and histone acetylation. By contrast, we show that complex I of the electron transport chain, the malate-aspartate shuttle and mitochondrial citrate export are required to maintain synthesis of aspartate, which is necessary for the proliferation of T helper cells. Furthermore, we find that mitochondrial citrate export and the malate-aspartate shuttle promote histone acetylation, and specifically regulate the expression of genes involved in T cell activation. Combining genetic, pharmacological and metabolomics approaches, we demonstrate that the differentiation and terminal effector functions of T helper cells are biochemically uncoupled. These findings support a model in which the malate-aspartate shuttle, mitochondrial citrate export and complex I supply the substrates needed for proliferation and epigenetic remodelling early during T cell activation, whereas complex II consumes the substrates of these pathways, which antagonizes differentiation and enforces terminal effector function. Our data suggest that transcriptional programming acts together with a parallel biochemical network to enforce cell state.


Conflict of interest statement

The authors declare no competing financial interests.

Figures

Extended Data Figure 1.
Extended Data Figure 1.. Acute ETC inhibition alters cell cycle but not viability in Th1 cells.
a, Viability measured by PI and Annexin-V staining of WT CD4 T cells cultured in Th1 conditions and treated overnight for 16 hours on day 1, 2, or 3 of culture with DMSO, rotenone, dimethyl malonate (DMM), antimycin A, or oligomycin (n = 3). b, cell cycle analysis measured by Ki-67 and DAPI of CD4 T cells cultured in Th1 conditions on day 3 following 16-hour overnight treatment with DMSO (n = 5), rotenone, DMM, antimycin A, or oligomycin (n = 6). n = number of technical replicates. Representative plots and a graph summarizing the results of three independent experiments are shown. Mean and s.d. of replicates are presented on summarized plots and unpaired, two-tailed t-test used to determine significance (*p<0.05, **p<0.01).
Extended Data Figure 2.
Extended Data Figure 2.. ETC regulation of proliferation is conserved among Th subtypes but ETC requirements for effector cytokine transcription differ between Th1, Th2, and Th17 cells.
Proliferation of WT CD4 T cells cultured in a, Th2, and b, Th17 conditions following 16-hour overnight treatment with DMSO, rotenone, or oligomycin (n = 3). Cell cycle analysis measured by Ki-67 and DAPI of CD4 T cells cultured in c, Th2, and d, Th17 conditions on day 3 following 16-hour overnight treatment with DMSO, rotenone, DMM, antimycin A, or oligomycin (n = 6). Effector cytokine transcription after PMA and ionomycin restimulation at day 5 measured by e, IL-4-GFP (4GET) reporter expression in cells cultured in Th2 conditions and f, IL17-GFP reporter expression in cells cultured in Th17 conditions following 16-hour overnight treatment with DMSO, rotenone, DMM, antimycin A, or oligomycin (n = 3). n = number of technical replicates. Representative plots and a graph summarizing the results of three independent experiments are shown. Mean and s.d. of replicates are presented on summarized plots and unpaired, two-tailed t-test used to determine significance (*p<0.05, **p<0.01; ***p<0.001, **** p<0.0001).
Extended Data Figure 3.
Extended Data Figure 3.. Complex II inhibition is functional and leads to a loss of IFNγ production in Th1 cells.
a, Cellular succinate at day 5 evaluated using Succinate Assay Kit (Abcam) in WT CD4 T cells cultured in Th1 conditions following 6-hour treatment with DMSO, 10 mM dimethyl malonate (DMM), 1 mM 3-nitropropionic acid (3NP), 100 μM thenoyltrifluoroacetone (TTFA), or 1 μM atpenin A5 (n = 3). b, IFNγ protein production after PMA and ionomycin restimulation at day 5 of WT CD4 T cells cultured in Th1 conditions following 16-hour overnight treatment with 10 mM diethyl succinate (DES) (n = 5) or DMSO (n = 4). c, IFNγ protein production after PMA and ionomycin restimulation at day 5 of Cas9tg CD4 T cells cultured in Th1 conditions transduced with one of three individual sgRNA targeting Sdha or an empty vector control (n = 3 biological replicates). Total cellular d, succinate and, e, α-ketoglutarate measured by LC-MS analysis in WT or Sdhc cKO CD4 T cells cultured in Th1 conditions after 4-hour culture in dialyzed FBS containing media at day 5 (n = 3). n = number of technical replicates unless otherwise stated. Representative plots and a graph summarizing the results of at least two independent experiments are shown. Mean and s.d. of replicates are presented on summarized plots and unpaired, two-tailed t-test used to determine significance (*p<0.05, **p<0.01; ***p<0.001, **** p<0.0001).
Extended Data Figure 4.
Extended Data Figure 4.. Retroviral expression of sgRNA in Cas9tg CD4 T cells.
a, Schematic of MG-guide retroviral vector. b, CD4 T cells from Cas9tg mice were stimulated with anti-CD3 and anti-CD28 coated beads for 24 hours and retrovirally transduced with either a MG-guide (empty vector) or a MG-guide vector cloned to express a sgRNA against Thy1 (Thy1 sgRNA). GFP expression was measured at 24 hours post-transduction, compared to non-transduced cells. c, Thy1.1 protein expression was measured in transduced (empty vector blue line; Thy1 sgRNA red line) and non-transduced cells (solid gray) by flow cytometry at 30 and 96 hours post transduction. d, Schematic of experimental design for functional Th1 sgRNA studies. e, CD4 T cells from Cas9tg mice were stimulated with anti-CD3 and anti-CD28 beads in IL-2 (5 ng/mL), anti-IL-4 (10 ug/mL), and IL-12 (2 ng/mL) and retrovirally transduced 24 hours after activation with either empty MG-guide (shaded blue) or MG-guide expressing a sgRNA against Tbx21 (outline). T-bet protein expression was measured by intracellular flow cytometry on day 3. f, Cas9tg CD4 T cells were cultured as above and infected with either MGguide, a sgRNA against Tbx21, or a sgRNA against Il12rb. IFNγ protein was measured by intracellular flow cytometry on day 5 after restimulation with PMA (20 ng/ml) and ionomycin (1 ug/ml).
Extended Data Figure 5.
Extended Data Figure 5.. Complex II regulates epigenetic modifications and program specific gene expression in Th1 cells.
a, H3K9Ac and H3K27Ac normalized to total cellular H3 and 1X DNA content on day 3 of WT CD4 T cells cultured in Th1 conditions after 16-hour overnight treatment with dimethyl malonate (DMM), oligomycin, BMS-303141, or butyrate (n = 3). b, H3K9Ac and, c, H3K27Ac at day 5 of Cas9tg CD4 T cells cultured in Th1 conditions transduced with one of three individual sgRNA targeting Sdha or an empty vector control (n = 3 biological replicates). d, Volcano plot summarizing RNA-sequencing data indicating most differentially regulated transcripts between WT and Sdhc cKO Th1 cells and e, GSEA enrichment plot of the gene ontology (GO) cytokine production pathway (n = 3 biological replicates). n = number of technical replicates unless otherwise stated. Representative plots and a graph summarizing the results of at least two independent experiments are shown. Mean and s.d. of replicates are presented on summarized plots and unpaired, two-tailed t-test used to determine significance (*p<0.05, **p<0.01).
Extended Data Figure 6.
Extended Data Figure 6.. The malate-aspartate shuttle and mitochondrial citrate export dynamically regulate histone acetylation and program specific gene expression in Th1 cells.
a, H3K27Ac, b, total cellular H3, c, H3K9Ac normalized to total cellular H3 and 1X DNA content, and d, H3K27Ac normalized to total cellular H3 and 1X DNA content on day 4 of Cas9tg CD4 T cells transduced with three individual sgRNA targeting Acly, Slc25a1, Mdh1, Slc25a11, or Slc1a3 or empty vector cultured in Th1 conditions (n = 3 biological replicates). Volcano plot summarizing RNA-sequencing data indicating most differentially regulated transcripts at day 5 in Ca9tg CD4 T cells cultured in Th1 conditions transduced with empty vector or one sgRNA targeting e, Slc25a1 or, f, Slc25a11 (n = 2 biological replicates). Representative plots and a graph summarizing the results of at least two independent experiments are shown. Mean and s.d. of replicates are presented on summarized plots and unpaired, two-tailed t-test used to determine significance (*p<0.05).
Extended Data Figure 7.
Extended Data Figure 7.. The malate-aspartate shuttle and mitochondrial citrate are required for proliferation in Th1 cells.
Proliferation of Cas9tg CD4 T cells transduced with empty vector control or one of three individual sgRNA targeting Acly, Slc25a1, Mdh1, Slc25a11, or Slc1a3 cultured in Th1 conditions at day 5 (n = 3 biological replicates). Representative plots and a graph summarizing the results of at least two independent experiments are shown. Mean and s.d. of replicates are presented on summarized plots and unpaired, two-tailed t-test used to determine significance (*p<0.05; **p<0.01).
Extended Data Figure 8.
Extended Data Figure 8.. The malate-aspartate shuttle and mitochondrial citrate export regulate cellular acetyl-CoA levels and cellular metabolism.
a, Cellular acetyl-CoA measured by LC-MS analysis in Cas9tg CD4 T cells transduced with empty vector or 2 individual sgRNA targeting Slc25a1 as described on day 5 of culture in Th1 conditions (n = 2 biological replicates; n = 3 technical replicates). b, Volcano plot and, c, heatmap of all metabolites measured by LC-MS analysis in Cas9tg CD4 T cells transduced with empty vector or 2 individual sgRNA targeting Slc25a1 as described on day 5 of culture in Th1 conditions (n = 2 biological replicates; n = 3 technical replicates). d, Volcano plot and, e, heatmap of all metabolites measured by LC-MS analysis in Cas9tg CD4 T cells transduced with empty vector or 2 individual sgRNA targeting Slc25a1 as described on day 5 of culture in Th1 conditions (n = 2 biological replicates; n = 2 technical replicates). Mean and s.d. of replicates are presented on summarized plots and unpaired, two-tailed t-test used to determine significance (**p<0.01; ****p<0.0001).
Extended Data Figure 9.
Extended Data Figure 9.. Complex I activity is required for aspartate production and cell cycle progression in activating Th1 cells.
a, Volcano plot and, b, heatmap of all metabolites measured by LC-MS analysis in WT CD4 T cells treated acutely for 4 hours on day 5 of culture in Th1 conditions (n = 3). c, Cell cycle analysis using Ki-67 and DAPI of WT CD4 T cells cultured in Th1 conditions at day 3 following 16-hour overnight treatment with DMSO or rotenone ± 20 mM aspartate (n = 3). n = number of technical replicates. Representative plots and a graph summarizing the results of at least two independent experiments are shown. Mean and s.d. of replicates are presented on summarized plots and unpaired, two-tailed t-test used to determine significance (**p<0.01; ****p<0.0001).
Extended Data Figure 10.
Extended Data Figure 10.. Conceptual models of mitochondrial metabolite transport and the consequence of metabolic perturbations on Th1 cell activation.
a, Early-stage Th1 cell activation is supported by the malate-aspartate shuttle and mitochondrial citrate export. These mitochondrial transport systems provide the key substrates needed for cell division and histone acetylation. Citrate export results in cytosolic acetyl-CoA production that can be used to synthesize the fatty acids needed for plasma membrane expansion during division as well as the acetyl-groups used for histone acetylation. Interconnected with this export pathway is the malate-aspartate shuttle, a carbon-neutral cycle that results in the net movement of NAD+ to the cytosol and NADH into the mitochondria, whereby it can fuel the activity of electron transport chain (ETC) Complex I. Through the activity of Complex I, NAD+ can be continually recycled, enabling the production of aspartate, an essential precursor for nucleotide synthesis. These processes are antagonized by the activity of succinate dehydrogenase (SDH)/ETC Complex II, which consumes α-ketoglutarate, limiting its availability for the malate-aspartate shuttle and promoting Th1 cell effector function. b, Th cell activation is defined by two major phases: 1) a period of rapid division and epigenetic remodeling; and 2) cell cycle arrest and cytokine production. Each of these phases is supported by a discrete component of mitochondrial metabolism. The malate-aspartate shuttle and citrate export generate the material needed for early phase differentiation to occur. As differentiation continues, the activity of Complex II draws carbon away from the shuttle and thus acts to pull activated Th1 cells out of the differentiation process and to enable to them to fully engage their terminal effector cell program. When the mitochondrial transport networks are disrupted, Th1 cells are unable to properly proliferate or epigenetically reprogram. In contrast, inhibiting the activity of Complex II causes activated Th1 cells to continuously proliferate and remodel their chromatin, preventing them from exiting the differentiation phase and engaging their terminal effector program.
Figure 1:
Figure 1:. The TCA cycle supports Th cell proliferation and function through distinct mechanisms.
a, Mean divisions at day 3 and b, Ifng-Katushka reporter expression after restimulation with PMA and ionomycin at day 5 of CD4 T cells cultured in Th1 conditions with serially diluted 2DG (n = 3) or NaFlAc (n = 2–3). c, Proliferation after overnight treatment on day 2, and d, intracellular IFNγ protein expression after overnight treatment on day 4 of Th1 cultured WT CD4 T cells with DMSO, rotenone, dimethyl malonate (DMM), antimycin A, oligomycin, or BMS-303141 (n = 3). n = number of technical replicates. Representative plots and a graph summarizing the results of at least two independent experiments are shown. Mean and s.d. of replicates are presented on summarized plots and unpaired, two-tailed t-test used to determine significance (*p<0.05, **p<0.01; ***p<0.001, **** p<0.0001).
Figure 2:
Figure 2:. Complex II uncouples Th1 cell differentiation and effector function.
a, Intracellular IFNγ protein expression in PMA and Ionomycin restimulated WT CD4 T cells cultured in Th1 conditions at day 5 after overnight treatment with DMSO, DMM (10mM), 3-nitropropionic acid (3NP; 1mM), thenoyltrifluoroaceton (TTFA; 100μM), or atpenin A5 (1μM) (n = 3). b, Intracellular IFNγ protein expression and c, proliferation of CD4 T cells from doxycycline-treated Sdhcfl/fl TetO-Cre−/+ R26rtTA/+ (Sdhc cKO) or Sdhc+/+ TetO-Cre−/+ R26rtTA/+ (WT) mice cultured in Th1 conditions at day 5, (data combined from 5 independent experiments, WT: n = 13, Sdhc cKO: n = 14 biological replicates), two-tailed t-test. d, Total cellular H3K9Ac of WT and Sdhc cKO cells cultured in Th1 conditions at day 3 (n = 3), two-sided t-test. e, Tbet protein expression of WT (n = 4) and Sdhc cKO (n = 3) cells cultured in Th1 conditions at day 5, two-sided t-test. f, DAVID GO pathway analysis of genes downregulated in cKO mice compared to WT controls, p<0.05. g, Heatmap of gene expression from RNA-seq results for the Cytokine Production GO Pathway. n = number of technical replicates except where noted otherwise. Representative plots and a graph summarizing the results of at least two independent experiments are shown, except where noted otherwise. Mean and s.d. of replicates are presented on summarized plots and unpaired, two-tailed t-test used to determine significance (**p<0.01; ***p<0.001, **** p<0.0001).
Figure 3:
Figure 3:. The malate-aspartate shuttle and mitochondrial citrate export are required for histone acetylation and proliferation in differentiating Th1 cells.
a, Schematic diagram of the malate-aspartate shuttle and mitochondrial citrate export. b, Intracellular IFNγ protein expression in Cas9tg CD4 T cells transduced with distinct sgRNAs targeting each of the enzymes and transporters indicated cultured in Th1 conditions after restimulation at day 5. Graphs show individual sgRNA for each gene as well as the average for all three sgRNAs (n = 2–3 biological replicates). c,d, Total cellular H3K9Ac at day 4 of Cas9tg CD4 T cells transduced with distinct sgRNAs against each of the enzymes and transporters indicated, in the absence or presence of 5nM or 20nM exogenous acetate added one day after transduction, cultured in Th1 conditions (n = 3 technical replicates). Heatmap summarizing downregulated genes determined by RNA-seq for cells expressing e, Slc25a1 targeting sgRNA or f, Slc25a11 targeting sgRNA, p<0.05. Representative plots and a graph summarizing the results of at least two independent experiments are shown. Mean and s.d. of replicates are presented on summarized plots and unpaired, two-sided t-test used to determine significance (*p<0.05; **p<0.01; ***p<0.001).
Figure 4:
Figure 4:. The malate-aspartate shuttle promotes Complex I activity, which is required for aspartate synthesis and Th cell proliferation.
a, Cellular NADH/NAD+ ratio and N-carbamoyl-L-aspartate measured by LC-MS analysis in Cas9tg CD4 T cells transduced with sgRNA targeting Scl25a11 and cultured in Th1 conditions as described in Methods (n = 2 biological replicates, n = 2 technical replicates). b, Baseline OCR, maximal OCR, and baseline ECAR of Cas9tg CD4 T cells transduced with distinct sgRNAs targeting each of the enzymes and transporters indicated cultured in Th1 conditions at day 4 (n = 3 biological replicates). c, Cellular NADH/NAD+ and ATP/AMP ratios and d, aspartate and N-carbamoyl-L-aspartate measured by LC-MS analysis in WT CD4 T cells cultured in Th1 conditions and treated with DMSO or rotenone for 4 hours on day 4 (n = 3 technical replicates). e, proliferation measured at day 3 of WT CD4 T cells cultured in Th1 conditions and treated on day 2 with DMSO (clear and grey bar) or rotenone (blue bars) ± 20 mM aspartate (n = 3 technical replicates). Representative plots and a graph summarizing the results of at least two independent experiments are shown. Mean and s.d. are presented on summarized plots and unpaired, two-sided t-test used to determine significance (*p<0.05; **p<0.01; ***p<0.0001; ****p<0.00001).

References

    1. Buck MD, Sowell RT, Kaech SM & Pearce EL Metabolic Instruction of Immunity. Cell 169, 570–586 (2017). - PMC - PubMed
    1. Buck MD, O’Sullivan D. & Pearce EL T cell metabolism drives immunity. J. Exp. Med 212, 1345–60 (2015). - PMC - PubMed
    1. Klein Geltink RI et al. Mitochondrial Priming by CD28. Cell 171, 385–397.e11 (2017). - PMC - PubMed
    1. Buck MD et al. Mitochondrial Dynamics Controls T Cell Fate through Metabolic Programming Correspondence. Cell 166, 63–76 (2016). - PMC - PubMed
    1. Chang C-H et al. Posttranscriptional control of T cell effector function by aerobic glycolysis. Cell 153, 1239–1251 (2013). - PMC - PubMed

Methods References

    1. Platt RJ et al. CRISPR-Cas9 knockin mice for genome editing and cancer modeling. Cell 159, 440–55 (2014). - PMC - PubMed
    1. Gagliani N. et al. Coexpression of CD49b and LAG-3 identifies human and mouse T regulatory type 1 cells. Nat. Med 19, 739 (2013). - PubMed
    1. Dobin A. et al. STAR: ultrafast universal RNA-seq aligner. Bioinformatics 29, 15–21 (2013). - PMC - PubMed
    1. Love MI, Huber W. & Anders S. Moderated estimation of fold change and dispersion for RNA-seq data with DESeq2. Genome Biol. 15, 550 (2014). - PMC - PubMed
    1. Lu W, Wang L, Chen L, Hui S. & Rabinowitz JD Extraction and Quantitation of Nicotinamide Adenine Dinucleotide Redox Cofactors. Antioxid. Redox Signal 28, 167–179 (2018). - PMC - PubMed

Publication types

MeSH terms