

Seasonal to decadal variability in ice discharge from the Greenland Ice Sheet
- PMID: 31217911
- PMCID: PMC6582977
- DOI: 10.5194/tc-12-3813-2018
Seasonal to decadal variability in ice discharge from the Greenland Ice Sheet
Abstract
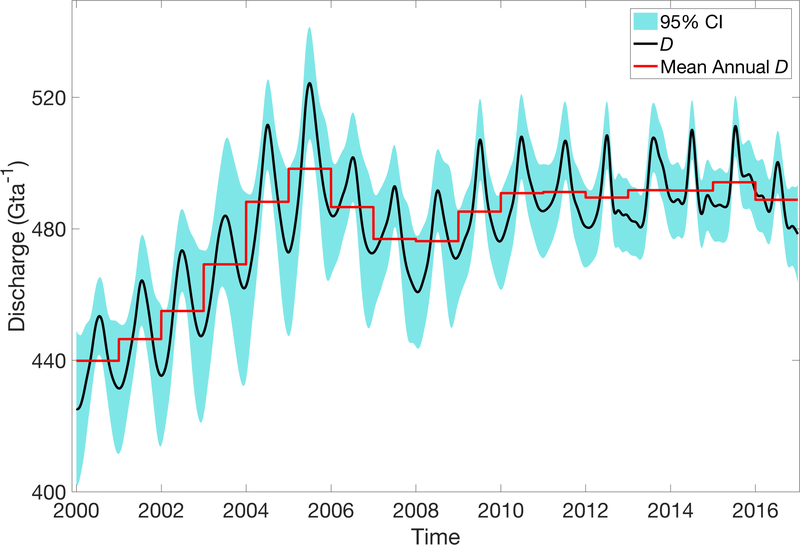
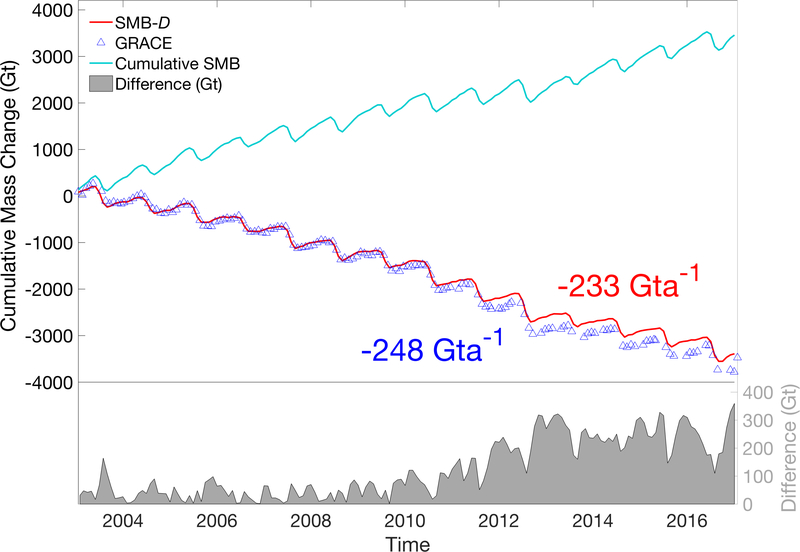
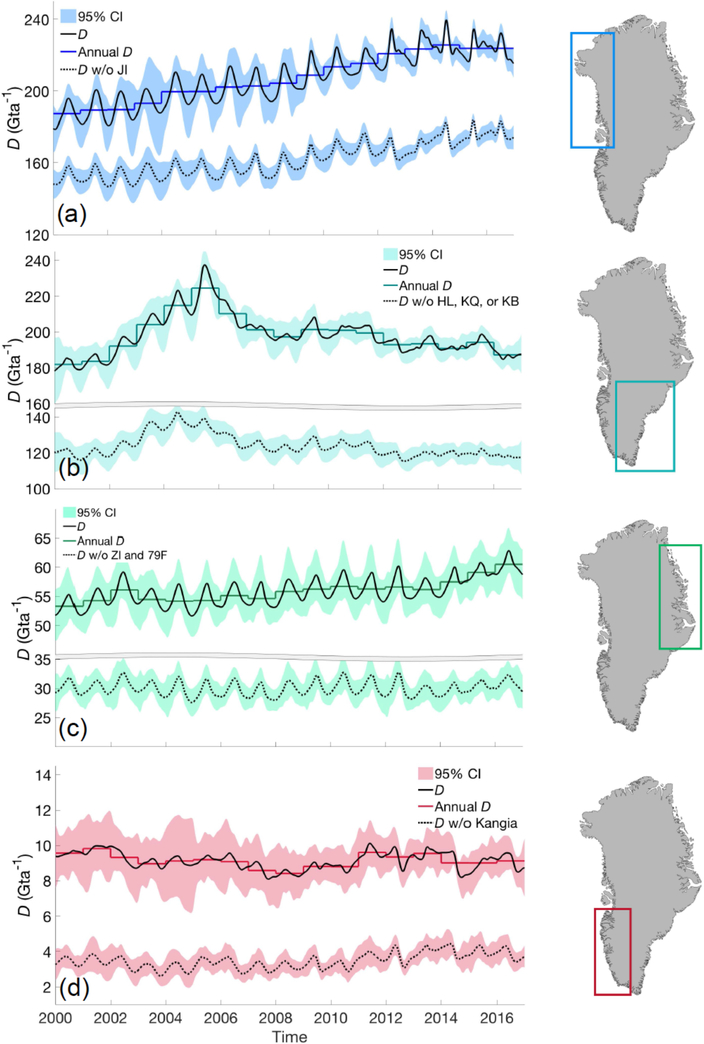
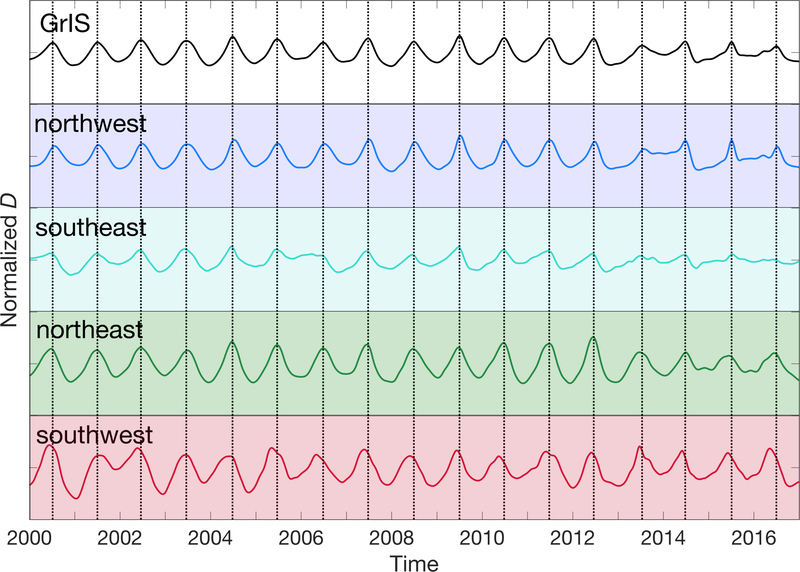
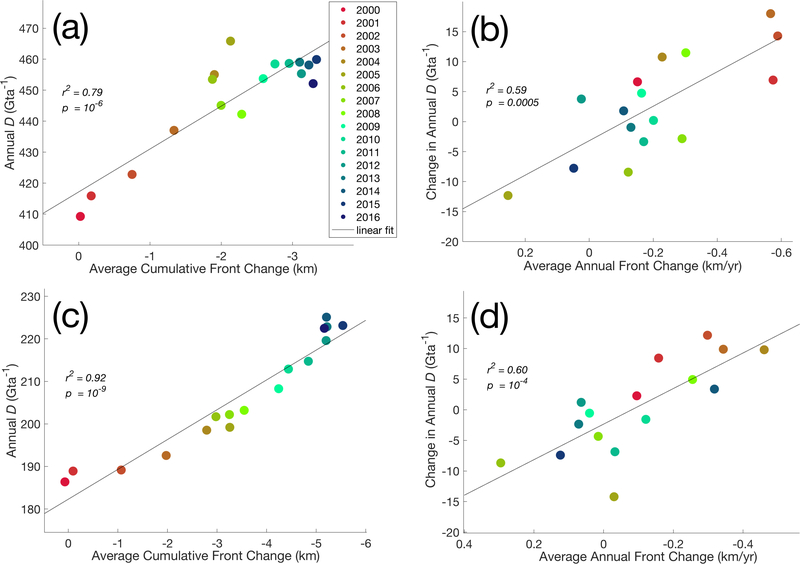
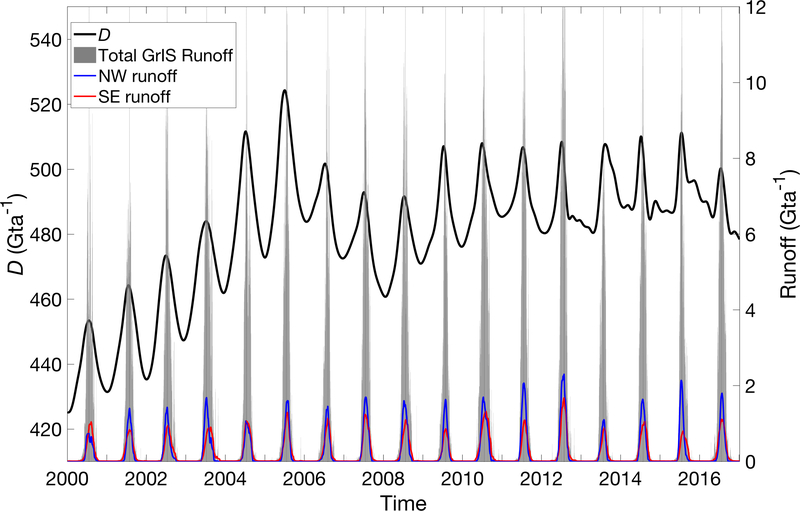
Rapid changes in thickness and velocity have been observed at many marine-terminating glaciers in Greenland, impacting the volume of ice they export, or discharge, from the ice sheet. While annual estimates of ice-sheet wide discharge have been previously derived, higher-resolution records are required to fully constrain the temporal response of these glaciers to various climatic and mechanical drivers that vary in sub-annual scales. Here we sample outlet glaciers wider than 1 km (N = 230) to derive the first continuous, ice-sheet wide record of total ice sheet discharge for the 2000-2016 period, resolving a seasonal variability of 6 %. The amplitude of seasonality varies spatially across the ice sheet from 5 % in the southeastern region to 9 % in the northwest region. We analyze seasonal to annual variability in the discharge time series with respect to both modelled meltwater runoff, obtained from RACMO2.3p2, and glacier front position changes over the same period. We find that year-to-year changes in total ice sheet discharge are related to annual front changes (r 2 = 0.59, p = 10-4) and that the annual magnitude of discharge is closely related to cumulative front position changes (r 2 = 0.79), which show a net retreat of > 400 km, or an average retreat of > 2 km at each surveyed glacier. Neither maximum seasonal runoff or annual runoff totals are correlated to annual discharge, which suggests that larger annual quantities of runoff do not relate to increased annual discharge. Discharge and runoff, however, follow similar patterns of seasonal variability with near-coincident periods of acceleration and seasonal maxima. These results suggest that changes in glacier front position drive secular trends in discharge, whereas the impact of runoff is likely limited to the summer months when observed seasonal variations are substantially controlled by the timing of meltwater input.
Conflict of interest statement
Competing interests The authors declare that they have no conflict of interest.
Figures
References
-
- Andersen ML, Nettles M, Elosegui P, Larsen TB, Hamilton GS and Stearns LA: Quantitative estimates of velocity sensitivity to surface melt variations at a large Greenland outlet glacier, J. Glaciol, 57(204), 609–620, doi: 10.3189/002214311797409785, 2011. - DOI
-
- Bartholomew I, Nienow P, Mair D, Hubbard A, King MA and Sole A: Seasonal evolution of subglacial drainage and acceleration in a Greenland outlet glacier, Nat. Geosci, 3, 408–411, doi:10.1038/ngeo863, 2010. - DOI
-
- Bartholomaus TC, Stearns LA, Sutherland DA, Shroyer EL, Nash JD, Walker RT, Catania G, Felikson D, Carroll D, Fried MJ, Noël BPY and Broeke MRVANDEN: Contrasts in the response of adjacent fjords and glaciers to ice-sheet surface melt in West Greenland, Ann. Glaciol, 57(73), 25–38, doi:10.1017/aog.2016.19, 2016. - DOI
-
- Bendtsen J, Mortensen J, Lennert K, Jens KE, Boone W, Galindo V, Hu Y, Dmitrenko IA, Kirillov SA, Kjeldsen KK, Kristoff Y, Barber DG and Rysgaard S: Sea ice breakup and marine melt of a retreating tidewater outlet glacier in northeast Greenland (81 ° N), Nature, 1–11, doi: 10.1038/s41598-017-05089-3, 2017. - DOI - PMC - PubMed
-
- Bolch T, Sandberg Sørensen L, Simonsen SB, Mölg N, MacHguth H, Rastner P and Paul F: Mass loss of Greenland’s glaciers and ice caps 2003–2008 revealed from ICESat laser altimetry data, Geophys. Res. Lett, 40(5), 875–881, doi: 10.1002/grl.50270, 2013. - DOI
Grants and funding
LinkOut - more resources
Full Text Sources
Other Literature Sources