Tuning the π-bridge of quadrupolar triarylborane chromophores for one- and two-photon excited fluorescence imaging of lysosomes in live cells
- PMID: 31217943
- PMCID: PMC6549598
- DOI: 10.1039/c9sc00793h
Tuning the π-bridge of quadrupolar triarylborane chromophores for one- and two-photon excited fluorescence imaging of lysosomes in live cells
Abstract
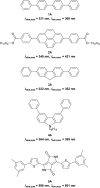
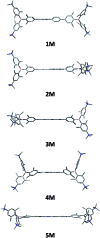
A series of tetracationic quadrupolar chromophores containing three-coordinate boron π-acceptors linked by different π-bridges, namely 4,4'-biphenyl, 2,7-pyrene, 2,7-fluorene, 3,6-carbazole and 5,5'-di(thien-2-yl)-3,6-diketopyrrolopyrrole, were synthesized. While their neutral precursors 1-5 displayed highly solvatochromic fluorescence, the water-soluble tetracationic target molecules 1M-5M, did not, but their emission colour could be tuned from blue to pink by changing the π-bridge. Compound 5M, containing the diketopyrrolopyrrole bridge, exhibits the most red-shifted absorption and emission maxima and the largest two-photon absorption cross-section (4560 GM at 740 nm in MeCN). Confocal laser scanning fluorescence microscopy studies in live cells confirm localization of the dye at the lysosome. Moreover, the low cytotoxicity, and high photostability of 5M combined with two-photon excited fluorescence imaging studies demonstrate its excellent potential for lysosomal imaging in live cells.
Figures


Similar articles
-
Water-Soluble Triarylborane Chromophores for One- and Two-Photon Excited Fluorescence Imaging of Mitochondria in Cells.Chemistry. 2016 Oct 4;22(41):14701-6. doi: 10.1002/chem.201602639. Epub 2016 Sep 15. Chemistry. 2016. PMID: 27627995
-
Optimization of Aqueous Stability versus π-Conjugation in Tetracationic Bis(triarylborane) Chromophores: Applications in Live-Cell Fluorescence Imaging.Chemistry. 2019 Jun 7;25(32):7679-7688. doi: 10.1002/chem.201900723. Epub 2019 Apr 30. Chemistry. 2019. PMID: 30900778
-
Trivalent boron as an acceptor in donor-pi-acceptor-type compounds for single- and two-photon excited fluorescence.Chemistry. 2003 Oct 17;9(20):5074-84. doi: 10.1002/chem.200304833. Chemistry. 2003. PMID: 14562325
-
Critical Overview of the Use of Ru(II) Polypyridyl Complexes as Photosensitizers in One-Photon and Two-Photon Photodynamic Therapy.Acc Chem Res. 2017 Nov 21;50(11):2727-2736. doi: 10.1021/acs.accounts.7b00180. Epub 2017 Oct 23. Acc Chem Res. 2017. PMID: 29058879 Review.
-
Lighting the Way to See Inside Two-Photon Absorption Materials: Structure-Property Relationship and Biological Imaging.Materials (Basel). 2017 Feb 23;10(3):223. doi: 10.3390/ma10030223. Materials (Basel). 2017. PMID: 28772584 Free PMC article. Review.
Cited by
-
Methyl Viologens of Bis-(4'-Pyridylethynyl)Arenes - Structures, Photophysical and Electrochemical Studies, and their Potential Application in Biology.Chemistry. 2022 Jul 15;28(40):e202200753. doi: 10.1002/chem.202200753. Epub 2022 May 30. Chemistry. 2022. PMID: 35502627 Free PMC article.
-
Electron-Rich EDOT Linkers in Tetracationic bis-Triarylborane Chromophores: Influence on Water Stability, Biomacromolecule Sensing, and Photoinduced Cytotoxicity.Chemistry. 2022 Aug 26;28(48):e202201130. doi: 10.1002/chem.202201130. Epub 2022 Jul 4. Chemistry. 2022. PMID: 35647673 Free PMC article.
-
An Iterative Divergent Approach to Conjugated Starburst Borane Dendrimers.Chemistry. 2020 Oct 9;26(57):12951-12963. doi: 10.1002/chem.202001985. Epub 2020 Sep 16. Chemistry. 2020. PMID: 32428359 Free PMC article.
-
The Nature of the (Oligo/Hetero)Arene Linker Connecting Two Triarylborane Cations Controls Fluorimetric and Circular Dichroism Sensing of Various ds-DNAs and ds-RNAs.Molecules. 2023 May 25;28(11):4348. doi: 10.3390/molecules28114348. Molecules. 2023. PMID: 37298825 Free PMC article.
-
Stereospecific Synthesis and Photophysical Properties of Propeller-Shaped C90 H48 PAH.Chemistry. 2019 Dec 18;25(71):16241-16245. doi: 10.1002/chem.201904962. Epub 2019 Nov 19. Chemistry. 2019. PMID: 31742798 Free PMC article.
References
-
- Entwistle C. D., Marder T. B. Angew. Chem., Int. Ed. 2002;41:2927–2931. - PubMed
-
- Entwistle C. D., Marder T. B. Chem. Mater. 2004;16:4574–4585.
-
- Yamaguchi S., Wakamiya A. Pure Appl. Chem. 2006;78:1413–1424.
-
- Jäkle F. Coord. Chem. Rev. 2006;250:1107–1121.
-
- Elbing M., Bazan G. C. Angew. Chem., Int. Ed. 2008;47:834–838. - PubMed
LinkOut - more resources
Full Text Sources
Research Materials
Miscellaneous

