Review
. 2019 May 8;6(5):181870.
doi: 10.1098/rsos.181870. eCollection 2019 May.

Communicating uncertainty about facts, numbers and science

Affiliations
Review

Communicating uncertainty about facts, numbers and science

Anne Marthe van der Bles et al. R Soc Open Sci. .

Abstract

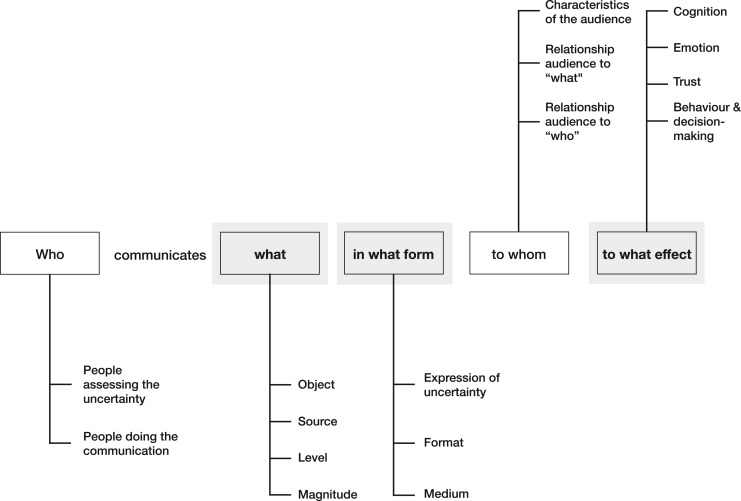
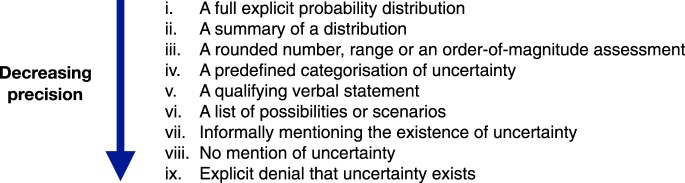
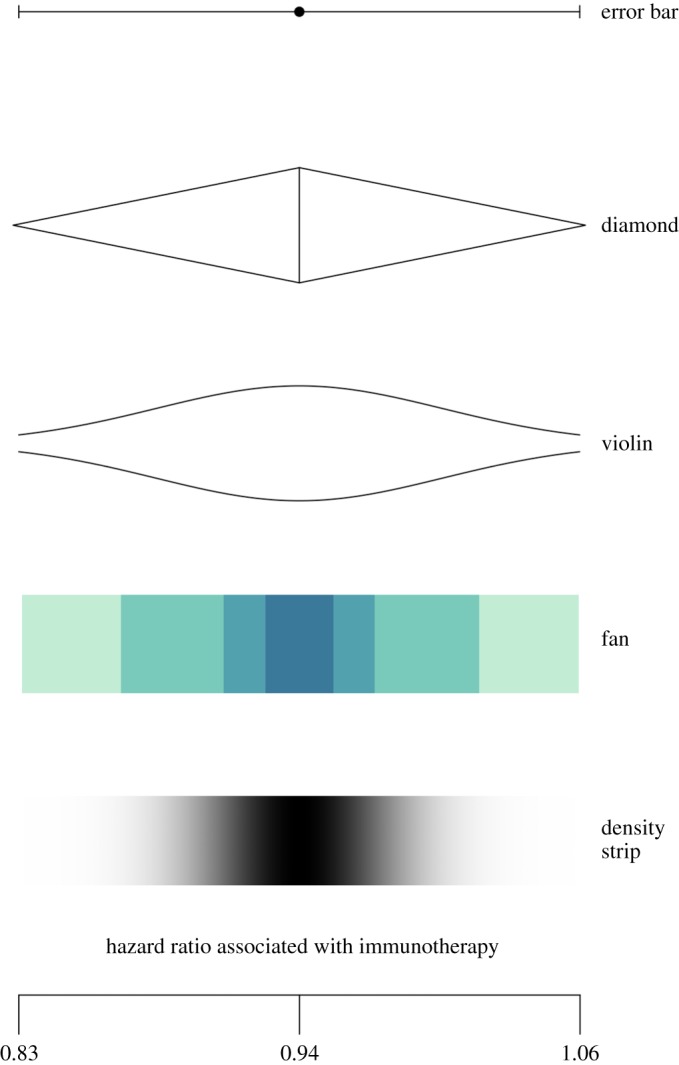
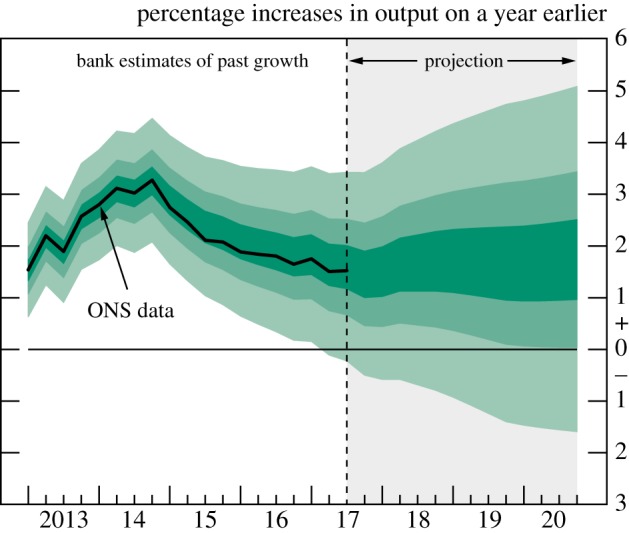
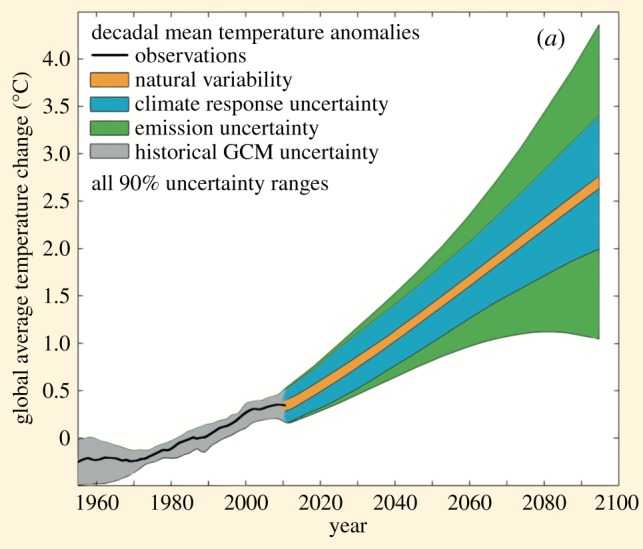
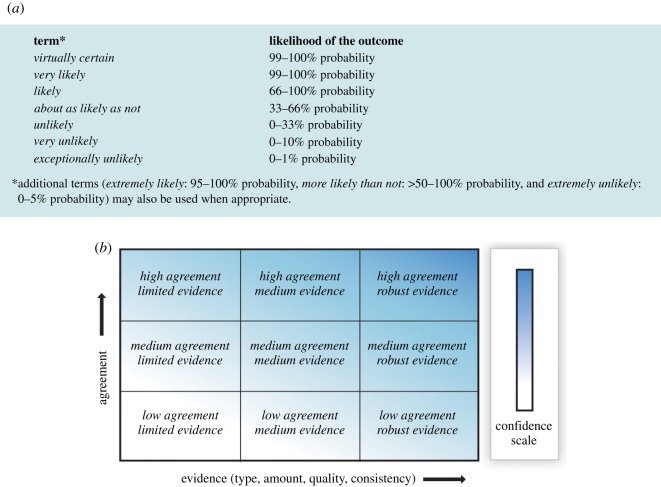
Uncertainty is an inherent part of knowledge, and yet in an era of contested expertise, many shy away from openly communicating their uncertainty about what they know, fearful of their audience's reaction. But what effect does communication of such epistemic uncertainty have? Empirical research is widely scattered across many disciplines. This interdisciplinary review structures and summarizes current practice and research across domains, combining a statistical and psychological perspective. This informs a framework for uncertainty communication in which we identify three objects of uncertainty-facts, numbers and science-and two levels of uncertainty: direct and indirect. An examination of current practices provides a scale of nine expressions of direct uncertainty. We discuss attempts to codify indirect uncertainty in terms of quality of the underlying evidence. We review the limited literature about the effects of communicating epistemic uncertainty on cognition, affect, trust and decision-making. While there is some evidence that communicating epistemic uncertainty does not necessarily affect audiences negatively, impact can vary between individuals and communication formats. Case studies in economic statistics and climate change illustrate our framework in action. We conclude with advice to guide both communicators and future researchers in this important but so far rather neglected field.

Keywords: IPCC; economic statistics; epistemic uncertainty; grade; uncertainty communication.


Conflict of interest statement

We declare we have no competing interests.

Figures

Figure 1.
Figure 1.
Basic deconstruction of the communication of epistemic uncertainty based on the Lasswell model of communication [15]. Our emphases in this paper—what, in what form and to what effect, are indicated in bold.
Figure 2.
Figure 2.
Alternative expressions for communicating direct uncertainty about a fact, number or scientific hypothesis.
Figure 3.
Figure 3.
The Education Endowment Foundation's summary of five educational interventions, in terms of cost, evidence strength and impact measured in months of educational advancement. ‘Evidence strength’ is a summary of the quality of evidence (indirect uncertainty) underlying the estimates of impact on an ordered categorical scale, analogous to a ‘star-rating’.
Figure 4.
Figure 4.
A Cochrane ‘summary of findings’ table illustrating both direct (confidence interval) and indirect (GRADE scale) levels of uncertainty [74].
Figure 5.
Figure 5.
Common expressions of uncertainty around numbers, illustrated using the immunotherapy example in figure 4: an (i) error bar; (ii) diamond; (iii) violin plot; (iv) fan plot and (v) density strip.
Figure 6.
Figure 6.
Bank of England's fan chart for GDP growth (from the November 2017 ‘Inflation Report’ [173]). In their notes to this chart the Bank write: ‘The fan chart depicts the probability of various outcomes for GDP growth… To the left of the vertical dashed line, the distribution reflects the likelihood of revisions to the data over the past; to the right, it reflects uncertainty over the evolution of GDP growth in the future…The fan chart is constructed so that outturns are also expected to lie within each pair of the lighter green areas on 30 occasions. In any particular quarter of the forecast period, GDP growth is therefore expected to lie somewhere within the fan on 90 out of 100 occasions’.
Figure 7.
Figure 7.
Global average temperature change (IPCC). Adapted from the IPCC [38]. Diagram showing the relative importance of different uncertainties, and their evolution in time. (a) Decadal mean surface temperature change (°C) from the historical record (black line), with climate model estimates of uncertainty for historical period (grey), along with future climate projections and uncertainty. Values are normalized by means from 1961 to 1980. The given uncertainty range of 90% means that the temperature is estimated to be in that range, with a probability of 90%.
Figure 8.
Figure 8.
The IPCC's two metrics for communicating the degree of certainty in their findings: (a) expressions of uncertainty and (b) confidence in the science [, p. 36].

References

    1. 2018. Cambridge dictionary. Cambridge, UK: Cambridge University Press.
    1. Manski CF. 2007. Identification for prediction and decision. Cambridge, MA: Harvard University Press.
    1. The British Government. 2003. Iraq's weapons of mass destruction: the Assessment of the British Government.
    1. Butler P, Chilcot J, Inge L, Mates M, Taylor A. 2004. Review of intelligence on weapons of mass destruction. House Commons Comm. Rep.
    1. Walpole RD, Pillar P, Gershwin LK, Landry JR. . 2002. Iraq's Continuing Programs for Weapons of Mass Destruction.

LinkOut - more resources