. 2019 May 1;9(5):906-926.
eCollection 2019.

Combination of enzastaurin and ATRA exerts dose-dependent dual effects on ATRA-resistant acute promyelocytic leukemia cells

Affiliations

Combination of enzastaurin and ATRA exerts dose-dependent dual effects on ATRA-resistant acute promyelocytic leukemia cells

Cui Liang et al. Am J Cancer Res. .

Abstract

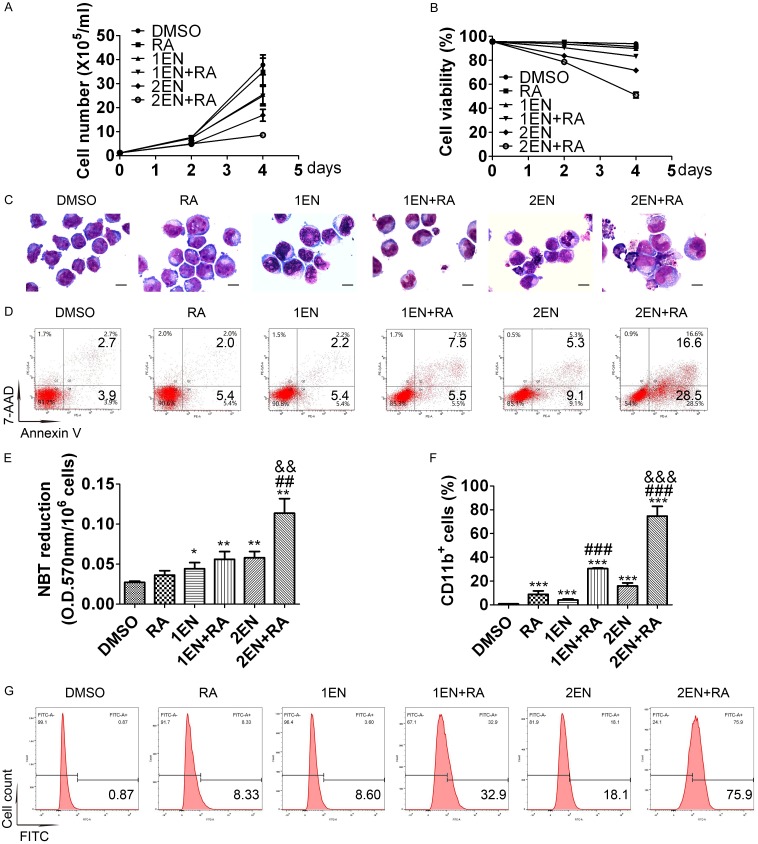
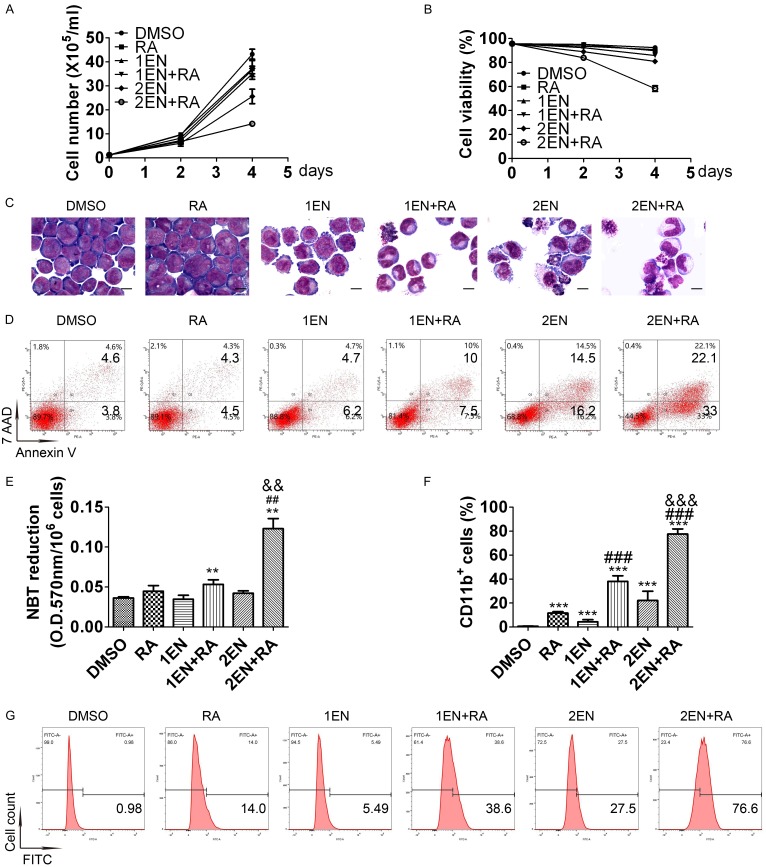
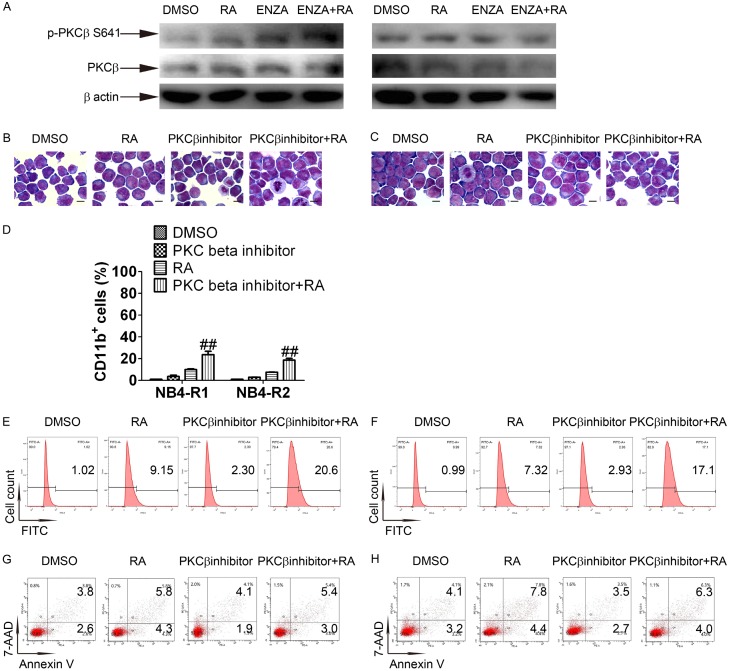
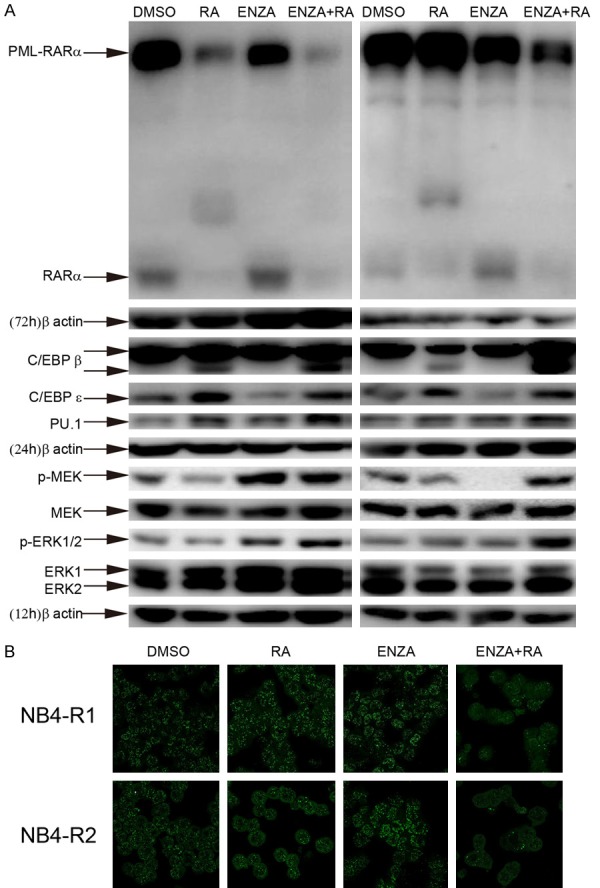
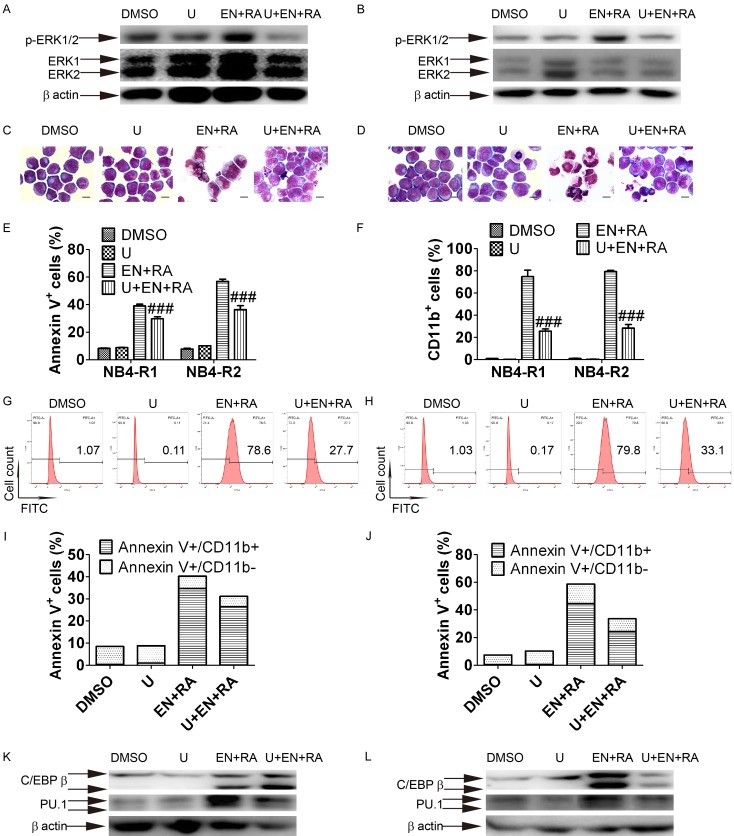
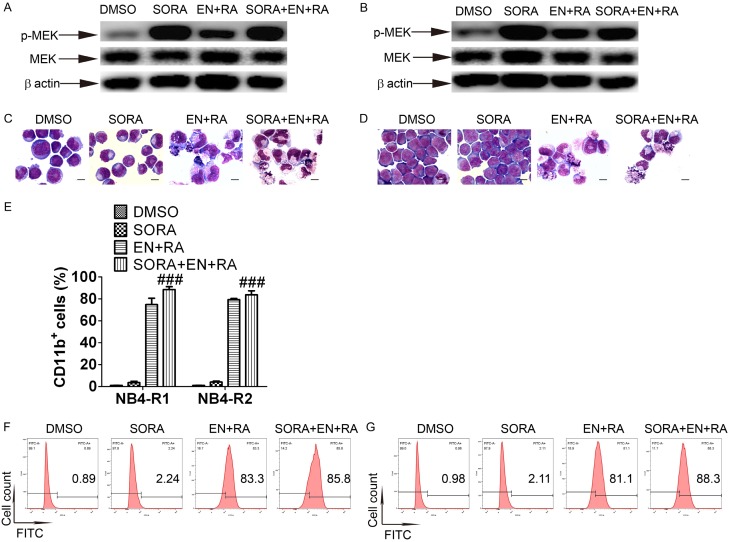
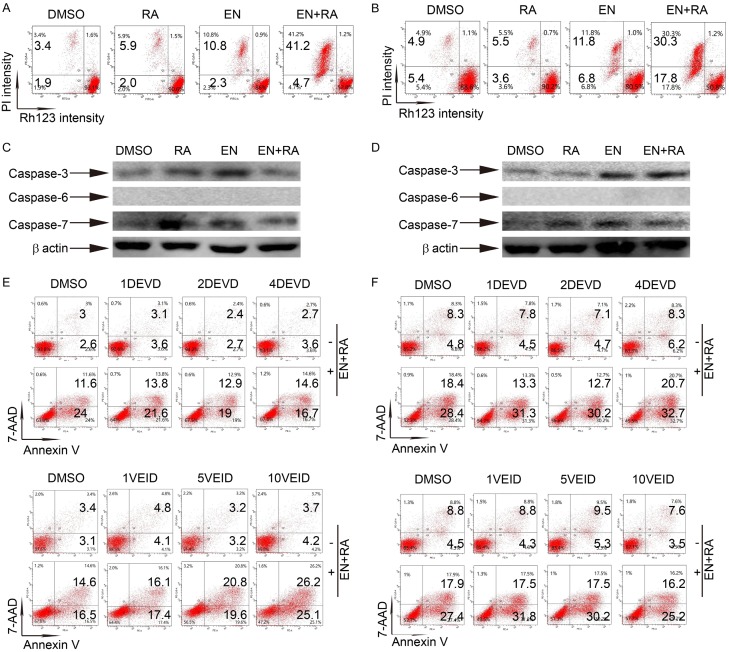
All-trans retinoic acid (ATRA) resistance continues to be a critical problem in acute promyelocytic leukemia (APL)-relapsed patients. In this study, a clinically achievable concentration of enzastaurin synergized with ATRA to induce differentiation and apoptosis in ATRA-resistant APL cell lines, NB4-R1 and NB4-R2. Mechanistically, although enzastaurin is a protein kinase Cβ (PKCβ) inhibitor, PKCβ may not be required since the activity of PKCβ was not suppressed by enzastaurin-ATRA (enz-ATRA) co-treatment, and another PKCβ-selective inhibitor did not mimic the effects of enzastaurin. An MEK inhibitor but not a RAF-1 inhibitor suppressed enz-ATRA treatment-triggered differentiation, activation of MEK/ERK and up-regulation of CCAAT/enhancer binding protein β (C/EBPβ) and/or PU.1. Therefore, RAF-1-independent MEK/ERK signaling was required for enz-ATRA treatment-induced differentiation via modulation of the protein levels of C/EBPβ and/or PU.1. Enz-ATRA treatment collapsed mitochondrial transmembrane potential without the activation of caspase-3, -6 and -7. Moreover, caspase-3/7- and caspase-6-specific inhibitors had no inhibitory effect on enz-ATRA treatment-triggered apoptosis. Therefore, enz-ATRA treatment-induced apoptosis was mitochondria-dependent but caspase-independent. Enz-ATRA treatment degraded PML-RARα, which may be involved in enz-ATRA treatment-induced dual effects and may also be beneficial for APL eradication. These findings may provide a potential therapy for ATRA-resistant APL patients.

Keywords: Acute promyelocytic leukemia; all-trans retinoic acid; apoptosis; differentiation; enzastaurin.


Conflict of interest statement

None.

Figures

Figure 1
Figure 1
Effects of enz-ATRA treatment on cell growth, survival, apoptosis and differentiation in NB4-R1 cells. NB4-R1 cells were treated with 1 μM (1EN), 2 μM enzastaurin (2EN), 1 μM ATRA (RA) and in enz-ATRA combination (EN+RA) for four days. One representative experiment of cell growth (A) and cell viability (B) is shown. Each value represents the mean ± SD of triplicate samples. Similar results were obtained in three independent experiments. Representative morphology of NB4-R1 cells treated with the indicated drugs for four days (C). Scale bar represents 5 μm and the magnification is 1,000. Similar results were obtained in three independent experiments. Annexin-V assay of NB4-R1 cells treated with enzastaurin or/and ATRA for four days (D). The percentages of Annexin V+ cells are shown in the corresponding panels. Results were representative among three independent experiments. Differentiation was also evaluated by NBT-reduction assay (E) and flow-cytometric analysis of CD11b expression in NB4-R1 cells (F) with the indicated treatment for four days. For NBT-reduction assay, one representative experiment is shown. Each value represents the mean ± SD of triplicate samples. Similar results were obtained in three independent experiments. For flow-cytometric analysis of CD11b expression, each value represents the mean ± SD of three independent measurements. *P<0.05, **P<0.01, ***P<0.001 versus DMSO treated cells. ##P<0.01, ###P<0.001, versus ATRA treated cells. &&P<0.01, &&&P<0.001, as compared with 1EN+RA in NB4-R1 cells. The representative histogram of flow-cytometric analysis of CD11b expression in NB4-R1 cells with the indicated treatment for four days is also shown (G). The percentages of CD11b+ cells are shown in the corresponding panels.
Figure 2
Figure 2
Effects of enz-ATRA treatment on cell growth, survival, apoptosis and differentiation in NB4-R2 cells. NB4-R2 cells were treated with 1 μM (1EN), 2 μM enzastaurin (2EN), 1 μM ATRA (RA) and in enz-ATRA combination (EN+RA) for four days. One representative experiment of cell growth (A) and cell viability (B) is shown. Each value represents the mean ± SD of triplicate samples. Similar results were obtained in three independent experiments. Representative morphology of NB4-R2 cells treated with the indicated drugs for four days (C). Scale bar represents 5 μm and the magnification is 1,000. Similar results were obtained in three independent experiments. Annexin-V assay of NB4-R2 cells treated with enzastaurin or/and ATRA for four days (D). The percentages of Annexin V+ cells are shown in the corresponding panels. Results were representative among three independent experiments. Differentiation was also assessed by NBT-reduction assay (E) and flow-cytometric analysis of CD11b expression in NB4-R2 cells (F) with the indicated treatment for four days. For NBT-reduction assay, one representative experiment is shown. Each value represents the mean ± SD of triplicate samples. Similar results were obtained in three independent experiments. For flow-cytometric analysis of CD11b expression, each value represents the mean ± SD of three independent measurements. **P<0.01, ***P<0.001 versus DMSO treated cells. ##P<0.01, ###P<0.001, versus ATRA treated cells. &&P<0.01, &&&P<0.001, as compared with 1EN+RA in NB4-R2 cells. The representative histograms of flow-cytometric analysis of CD11b expression in NB4-R2 cells with the indicated treatment for four days are also shown (G). The percentages of CD11b+ cells are shown in the corresponding panels.
Figure 3
Figure 3
PKCβ may not be involved in enz-ATRA treatment-induced differentiation and apoptosis. (A) NB4-R1 (left panel) and NB4-R2 (right panel) cells were treated with 2 μM enzastaurin (ENZA), 1 μM ATRA (RA) alone and in combination (ENZA+RA) for 3 h. The activation of PKCβ was measured by Western-blotting analysis of phosphorylated PKCβ at serine 641. The same membrane incubated with anti-phospho-PKCβ (Ser 641) was stripped and followed by detection of PKCβ. The expression of β-actin was evaluated as internal control. The morphology of NB4-R1 (B) and NB4-R2 (C) cells treated with 200 nM PKCβ inhibitor and/or 1 μM ATRA (RA) for four days. Scale bar represents 5 μm and the magnification is 1,000. One representative experiment among three independent assays is shown. Differentiation was also assessed by flow-cytometric analysis of CD11b expression (D), and each value represents the mean ± SD of three independent measurements. ##P<0.01, versus ATRA treated cells. The representative histograms of flow-cytometric analysis of CD11b expression in NB4-R1 (E) and NB4-R2 (F) cells with the indicated treatment for four days are also shown. Apoptosis was evaluated by flow-cytometric analysis of Annexin-V in NB4-R1 (G) and NB4-R2 (H) cells with the indicated treatment for four days. The percentages of CD11b+ cells or Annexin-V+ cells are shown in the corresponding panels. Similar results were obtained in three independent experiments.
Figure 4
Figure 4
Enz-ATRA treatment degrades PML-RARa, enhances the protein levels of C/EBPβ and PU.1 and activates MEK/ERK pathway. A. NB4-R1 (left panel) and NB4-R2 (right panel) cells were treated with 2 μM enzastaurin (ENZA), 1 μM ATRA (RA) alone and in combination (ENZA+RA) for 12 h, 24 h or 72 h. The same membrane incubated with the antibodies to phosphorylated Erk1/2 or MEK1/2 was stripped and followed by detection of MEK and ERK1/2. Each time point has the corresponding expression of β-actin as internal control. Similar results were obtained in three independent experiments. B. Subcellular localization of PML/PML-RARa was analyzed by immunofluorescence with the indicated treatments for 72 h. One representative experiment among three independent assays is shown.
Figure 5
Figure 5
MEK inhibition primarily suppresses differentiation and restores the protein levels of C/EBPβ or PU.1. Cells were exposed to 0.5 μM U0126 for 1 h prior to other treatment. The attenuation of MEK activation by U0126 (U) was detected by Western-blotting analysis of phosphorylated ERK1/2 in NB4-R1 (A) and NB4-R2 cells (B) with indicated treatments for 12 h and 36 h, respectively. The same membrane incubated with the antibody to phosphorylated Erk1/2 was stripped and followed by detection of ERK1/2. Similar results were obtained in three independent experiments. Effect of U0126 on morphology in NB4-R1 (C) and NB4-R2 cells (D) incubated with the indicated drugs for four days. Scale bar represents 5 μm and the magnification is 1,000. One representative experiment among three independent assays is shown. Similar results were obtained in three independent experiments. The effect of U0126 on apoptosis and differentiation was also confirmed by Annexin-V assay (E) and flow-cytometric analysis of CD11b expression (F) in NB4-R1 and NB4-R2 cells with the indicated treatments for four days. Each value represented the mean ± SD of three independent measurements. ###P<0.001 versus ENZA+RA. The representative histograms of flow-cytometric analysis of CD11b expression in NB4-R1 (G) and NB4-R2 cells (H) with the indicated drugs for four days are also shown. The percentages of CD11b+ cells are shown in the corresponding panels. The column graph of CD11b and Annexin V double staining in NB4-R1 (I) and NB4-R2 cells (J) with the indicated drugs for four days. Results were representative among three independent experiments. The protein levels of C/EBPβ and PU.1 in NB4-R1 (K) and NB4-R2 (L) cells with the indicated drugs for 48 h was determined by Western-blotting analysis. Expression of β-actin was assessed as internal control. Similar results were obtained in three independent experiments.
Figure 6
Figure 6
RAF-1 is not required for enz-ATRA combination-activated MEK/ERK pathway and differentiation. NB4-R1 and NB4-R2 cells were pretreated with 0.5 μM sorafenib tosylate (SORA) for 1 h. The effect of SORA on MEK activation was measured by phosphorylated MEK with the indicated treatments for 12 h and 36 h respectively in NB4-R1 (A) and NB4-R2 cells (B). The same membrane incubated with the antibody to phosphorylated MEK was stripped and followed by detection of MEK. Expression of β-actin was assessed as internal control. Similar results were obtained in three independent experiments. The effect of SORA on enz-ATRA treatment-induced differentiation for four days was observed by morphologic changes in NB4-R1 (C) and NB4-R2 cells (D). Scale bar represents 5 μm and the magnification is 1,000. One representative experiment among three independent assays is shown. The effect of SORA on enz-ATRA treatment-induced differentiation was also confirmed by flow-cytometric analysis of CD11b expression (E). Each value represents the mean ± SD of three independent measurements. ###P<0.001 versus ENZA+RA. The representative histograms of flow-cytometric analysis of CD11b expression in NB4-R1 (F) and NB4-R2 cells (G) with the indicated drugs for four days are also shown. The percentages of CD11b+ cells are shown in the corresponding panels.
Figure 7
Figure 7
Enz-ATRA treatment-triggered apoptosis is mitochondria-dependent but caspase-independent. NB4-R1 (A) and NB4-R2 (B) cells were treated with 2 μM enzastaurin (EN) and/or 1 μM ATRA (RA) for four days. One representative scatter plots of flow-cytometric analysis of mitochondrial transmembrane potential (assessed by uptake of rhodamine 123 [Rh123]) is shown. The percentages of Rh123- cells are shown in the corresponding panels. Western-blotting analysis of caspase-3, caspase-6 and caspase-7 in NB4-R1 (C) and NB4-R2 (D) cells treated with 2 μM enzastaurin and/or 1 μM ATRA for 24 h. Expression of β-actin was assessed as internal control. Similar results were obtained in three independent experiments. NB4-R1 and NB4-R2 cells were pretreated with different concentrations of (1, 2, 4 μM) DEVD (caspase-3/7 inhibitor) or different concentrations of (1, 5, 10 μM) VEID (caspase-6 inhibitor) for 1 h prior to enz-ATRA treatment for four days. The effect of DEVD or VEID on enz-ATRA treatment-triggered apoptosis in NB4-R1 (E) and NB4-R2 (F) cells was determined by Annexin V analysis. The percentages of Annexin V+ cells are shown in the corresponding panels. Results were representative among three independent experiments.

References

    1. Shen ZX, Shi ZZ, Fang J, Gu BW, Li JM, Zhu YM, Shi JY, Zheng PZ, Yan H, Liu YF, Chen Y, Shen Y, Wu W, Tang W, Waxman S, de The H, Wang ZY, Chen SJ, Chen Z. All-trans retinoic acid/As2O3 combination yields a high quality remission and survival in newly diagnosed acute promyelocytic leukemia. Proc Natl Acad Sci. 2004;101:5328–5335. - PMC - PubMed
    1. Wang X, Lin Q, Lv F, Liu N, Xu Y, Liu M, Chen Y, Yi Z. LG-362B targets PML-RARα and blocks ATRA resistance of acute promyelocytic leukemia. Leukemia. 2016;30:1465–1474. - PubMed
    1. McCulloch D, Brown C, Iland H. Retinoic acid and arsenic trioxide in the treatment of acute promyelocytic leukemia: current perspectives. Onco Targets Ther. 2017;10:1585–1601. - PMC - PubMed
    1. Lou Y, Ma Y, Sun J, Ye X, Pan H, Wang Y, Qian W, Meng H, Mai W, He JS, Tong H, Jin J. Evaluating frequency of PML-RARA mutations and conferring resistance to arsenic trioxide-based therapy in relapsed acute promyelocytic leukemia patients. Ann Hematol. 2015;94:1829–1837. - PubMed
    1. Lo-coco F, Cimino G, Breccia M, Noguera I, Diverio D, Finolezzi E, Pogliani EM, Di Bona E, Micalizzi C, Kropp M, Venditti A, Tafuri A, Mandelli F. Gemtuzumab ozogamicin (Mylotarg) as a single agent for molecularly relapsed acute promyelocytic leukemia. Blood. 2004;104:1995–1999. - PubMed

LinkOut - more resources