. 2019 Mar;124(3):1474-1490.
doi: 10.1029/2018JC014547. Epub 2019 Mar 6.

The Role of Ekman Currents, Geostrophy, and Stokes Drift in the Accumulation of Floating Microplastic

Affiliations

The Role of Ekman Currents, Geostrophy, and Stokes Drift in the Accumulation of Floating Microplastic

Victor Onink et al. J Geophys Res Oceans. 2019 Mar.

Abstract

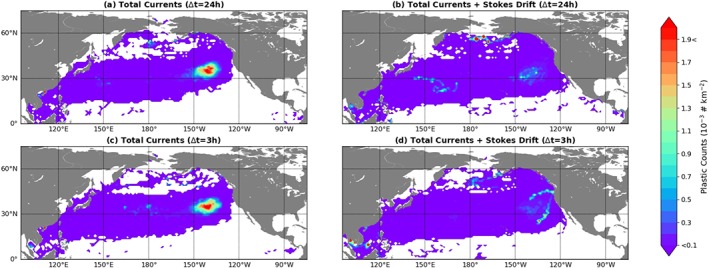
Floating microplastic in the oceans is known to accumulate in the subtropical ocean gyres, but unclear is still what causes that accumulation. We investigate the role of various physical processes, such as surface Ekman and geostrophic currents, surface Stokes drift, and mesoscale eddy activity, on the global surface distribution of floating microplastic with Lagrangian particle tracking using GlobCurrent and WaveWatch III reanalysis products. Globally, the locations of microplastic accumulation (accumulation zones) are largely determined by the Ekman currents. Simulations of the North Pacific and North Atlantic show that the locations of the modeled accumulation zones using GlobCurrent Total (Ekman+Geostrophic) currents generally agree with observed microplastic distributions in the North Pacific and with the zonal distribution in the North Atlantic. Geostrophic currents and Stokes drift do not contribute to large-scale microplastic accumulation in the subtropics, but Stokes drift leads to increased microplastic transport to Arctic regions. Since the WaveWatch III Stokes drift and GlobCurrent Ekman current data sets are not independent, combining Stokes drift with the other current components leads to an overestimation of Stokes drift effects and there is therefore a need for independent measurements of the different ocean circulation components. We investigate whether windage would be appropriate as a proxy for Stokes drift but find discrepancies in the modeled direction and magnitude. In the North Pacific, we find that microplastic tends to accumulate in regions of relatively low eddy kinetic energy, indicating low mesoscale eddy activity, but we do not see similar trends in the North Atlantic.

Keywords: Lagrangian modeling; global ocean circulation; microplastic accumulation; stokes drift.


Figures

Figure 1
Figure 1
Temporal mean flow fields for the (a) total, (b) Ekman and (c) geostrophic currents, and the (d) Stokes drift. Averages are taken for 2002–2014, with the normalized vectors indicating the mean direction and the color map indicating the current magnitude. Note that the velocity scale is logarithmic.
Figure 2
Figure 2
The average particle density of the final year of the global Lagrangian runs with the virtual particles advected by the daily mean (a) total, (b) Ekman and (c) geostrophic currents, and the (d) Stokes drift. The red and black boxes in the North Pacific and North Atlantic in panel (a) indicate the accumulation zone and extended accumulation zone for that basin used in the eddy kinetic energy analysis.
Figure 3
Figure 3
Connectivity of the ocean basins based on virtual particles advected with daily mean (a) total currents and the (b) sum of the daily mean total currents and Stokes drift. Particles are shown at their initial position colored according to their position at the end of the simulation. The coloring is based on the black boxes.
Figure 4
Figure 4
Normalized zonal and meridional spatial means of observed (van Sebille et al., 2015) and modeled microplastic concentrations with various daily mean surface current components for the North Pacific and North Atlantic simulations. (a, b) For the North Pacific the means are computed for the region of 0°N to 80°N and 120°E to 80°W. (c, d) In the North Atlantic the means computed are for the region 0°N to 80°N and 90°W to 60°E. All zonal and meridional distributions are normalized separately such that the integrated area under each curve is equal to 1.
Figure 5
Figure 5
Average eddy kinetic energy over time of particles that end within the accumulation zone, of particles that end within the extended accumulation zone, and of all particles within the North Pacific and North Atlantic simulations. The particles are advected with daily mean total currents. The North Atlantic accumulation zone is defined as 25°N to 35°N and 40°W to 70°W, while the extended North Atlantic accumulation zone is defined as 20°N to 40°N and 35°W to 75°W. The North Pacific accumulation zone is defined as 30°N to 40°N and 130°W to 150°W, while the extended North Pacific accumulation zone is defined as 25°N to 45°N and 125°W to 155°W, as shown in Figure 2a. Please note that the eddy kinetic energy axis is logarithmic.
Figure 6
Figure 6
The average particle density of the final year of North Atlantic Lagrangian simulations with the virtual particles advected by daily mean (a) Stokes drift and (b) 1%, (c) 3%, and (d) 5% windage from daily mean CFSR wind fields. CFSR = Climate Forecast System Reanalysis.
Figure 7
Figure 7
Root‐mean‐square error (RMSE) between the speed of the Stokes drift and the 1% Windage scenario. The RMSE is computed on a 0.5° × 0.5° grid for 1 January 2002 to 31 December 2014.
Figure 8
Figure 8
Coefficient of determination r2 for the zonal and meridional velocity components of Stokes drift and windage. Coefficients are computed on a 0.5° ×0.5° grid for 1 January 2002 to 31 December 2014.
Figure 9
Figure 9
The average particle density of the final year of North Atlantic Lagrangian simulations with the virtual particles advected by (a, c) total currents or (b, d) the sum of the total currents and Stokes drift. The flow field data sets have a temporal resolution of either Δt = 24 hours or Δt = 3 hours.
Figure 10
Figure 10
The average particle density of the final year of North Pacific Lagrangian simulations with the virtual particles advected by (a, c) total currents or (b, d) the sum of the total currents and Stokes drift. The flow field data sets have a temporal resolution of either Δt = 24 hr or Δt = 3 hr.

References

    1. Ardhuin, F. , Aksenov, Y. , Benetazzo, A. , Bertino, L. , Brandt, P. , Caubet, E. , Chapron, B. , Collard, F. , Cravatte, S. , Delouis, J.‐M. , Dias, F. , Dibarboure, G. , Gaultier, L. , Johannessen, J. , Korosov, A. , Manucharyan, G. , Menemenlis, D. , Menendez, M. , Monnier, G. , Mouche, A. , Nouguier, F. , Nurser, G. , Rampal, P. , Reniers, A. , Rodriguez, E. , Stopa, J. , Tison, C. , Ubelmann, C. , van Sebille, E. , & Xie, J. (2018). Measuring currents, ice drift, and waves from space: The sea surface kinematics multiscale monitoring (SKIM) concept. Ocean Science, 14(3), 337–354.
    1. Bennett, V. C. , & Mulligan, R. P. (2017). Evaluation of surface wind fields for prediction of directional ocean wave spectra during hurricane sandy. Coastal Engineering, 125, 1–15.
    1. Brach, L. , Deixonne, P. , Bernard, M. F. , Durand, E. , Desjean, M. C. , Perez, E. , van Sebille, E. , & ter Halle, A. (2018). Anticyclonic eddies increase accumulation of microplastic in the North Atlantic subtropical gyre. Marine Pollution Bulletin, 126, 191–96. - PubMed
    1. Breivik, Ø. , & Allen, A. A. (2008). An operational search and rescue model for the Norwegian Sea and the North Sea. Journal of Marine Systems, 69(1‐2), 99–113.
    1. Cancet, M. , Griffin, D. , Cahill, M. , Chapron, B. , Johannessen, J. , & Donlon, C. (2019). Evaluation of globcurrent surface ocean current products: A case study in Australia. Remote Sensing of Environment, 220, 71–93.