Meta-Analysis
. 2019 Sep;20(9):1187-1204.
doi: 10.1111/obr.12868. Epub 2019 Jun 19.

Impact of sugar-sweetened beverage taxes on purchases and dietary intake: Systematic review and meta-analysis

Affiliations
Meta-Analysis

Impact of sugar-sweetened beverage taxes on purchases and dietary intake: Systematic review and meta-analysis

Andrea M Teng et al. Obes Rev. 2019 Sep.

Abstract

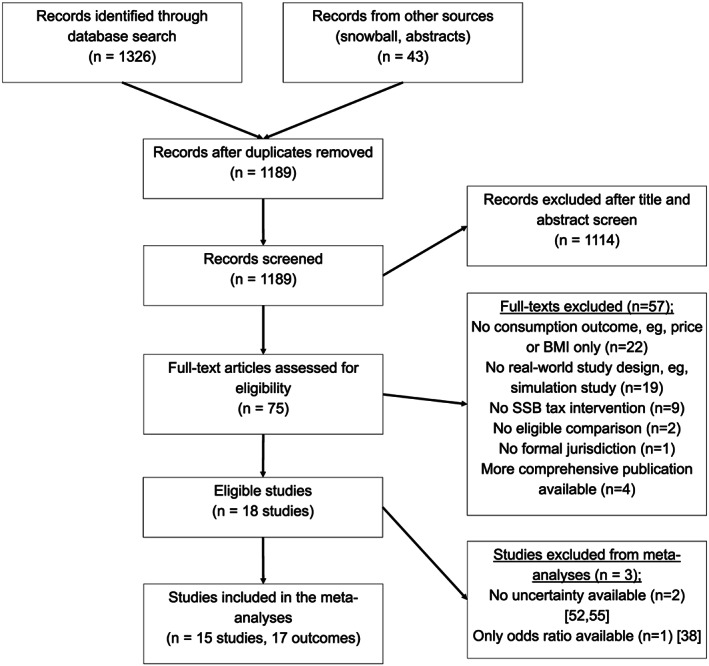
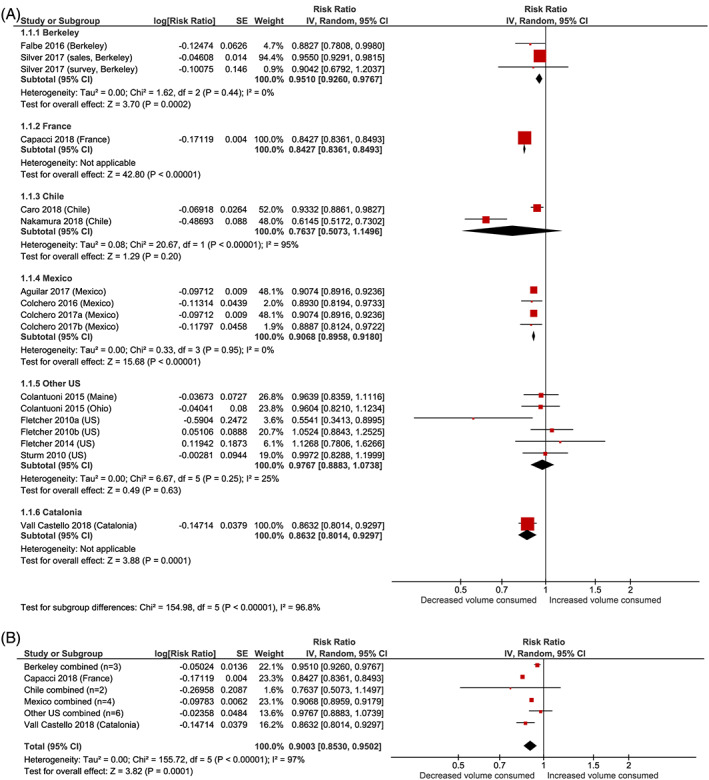
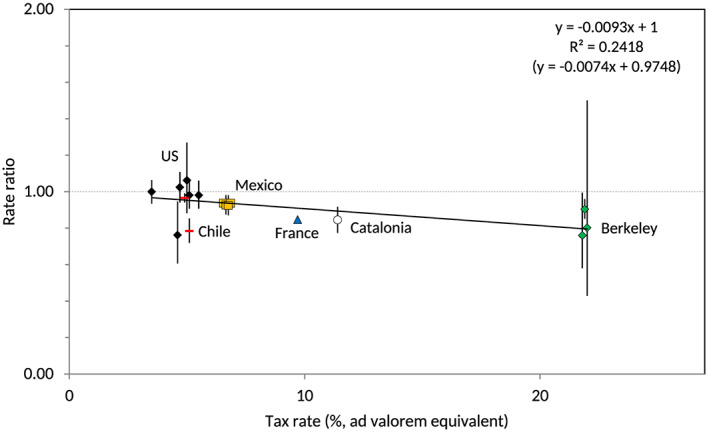
The aim was to conduct a systematic review of real-world sugar-sweetened beverage (SSB) tax evaluations and examine the overall impact on beverage purchases and dietary intake by meta-analysis. Medline, EconLit, Google Scholar, and Scopus databases were searched up to June 2018. SSB tax evaluations from any formal jurisdiction from cities to national governments were eligible if there was a comparison between pre-post tax (n = 11) or taxed and untaxed jurisdiction(s) (n = 6). The consumption outcome comprised sales, purchasing, and intake (reported by volume, energy, or frequency). Taxed and untaxed beverage consumption outcomes were examined separately by meta-analysis with adjustment for the size of each tax. The study was registered at PROSPERO (CRD42018100620). The equivalent of a 10% SSB tax was associated with an average decline in beverage purchases and dietary intake of 10.0% (95% CI: -5.0% to -14.7%, n = 17 studies, 6 jurisdictions) with considerable heterogeneity between results (I2 = 97%).The equivalent of a 10% SSB tax was also associated with a nonsignificant 1.9% increase in total untaxed beverage consumption (eg, water) (95% CI: -2.1% to 6.1%, n = 6 studies, 4 jurisdictions). Based on real-world evaluations, SSB taxes introduced in jurisdictions around the world appear to have been effective in reducing SSB purchases and dietary intake.

Keywords: evaluation; excise; meta-analysis; natural experiment; soft drinks; tax.


Conflict of interest statement

All authors have completed the ICMJE uniform disclosure form at http://www.icmje.org/coi_disclosure.pdf and declared support from the Health Research Council of New Zealand for the submitted work. The authors declare no other financial relationships with any organizations that might have an interest in the submitted work in the previous three years, and no other relationships or activities that could appear to have influenced the submitted work.

Figures

Figure 1
Figure 1
PRISMA flow diagram of the article selection process for studies evaluating real‐world sugar‐sweetened beverage taxes, June 2018. Note. Some studies contributed multiple outcomes if the study examined two different jurisdictions or used more than one unique data set
Figure 2
Figure 2
(A) Meta‐analysis step 1: Jurisdiction specific results for the average impact a 10% sugar‐sweetened beverage tax on consumption. (B) Meta‐analysis step 2: combining jurisdiction results for the average impact a 10% sugar‐sweetened beverage tax on consumption. Note. Meta‐analysis with inverse‐variance weights and random effects. Forest plot results were scaled to the expected effect of a 10% tax ( RR tax rate(%)/10% ). SE is standard error on log scale; CI is confidence interval; IV is inverse variance. RR is the relative change in taxed SSB consumption in posttax vs pretax period, or for the taxed jurisdiction compared with the control jurisdiction. This is a two‐step meta‐analysis where results within each jurisdiction were combined in the first meta‐analysis, and in the second step, these jurisdiction‐specific results were combined across jurisdictions. A single study's results were used if there was only one eligible study in a jurisdiction [Colour figure can be viewed at wileyonlinelibrary.com]
Figure 3
Figure 3
Funnel plot for examining publication bias in included studies on sugar‐sweetened beverage taxes for step one (left) and step two (right) of the meta‐analysis. Note. All results were scaled to the expected effect of a 10% tax. SE is standard error on log scale. RR is the relative change in taxed sugar‐sweetened beverage consumption for posttax compared with pretax period or taxed jurisdiction compared to control jurisdiction. Each study result is indicated here coloured by jurisdiction [Colour figure can be viewed at wileyonlinelibrary.com]
Figure 4
Figure 4
Impact of sugar‐sweetened beverage taxes on consumption by the size of the tax in posttax compared with pretax period and/or taxed jurisdiction compared with a control jurisdiction. Note. Evaluations for the same tax were staggered to improve display of results. An alternative equation is presented in parentheses for a linear relationship (not displayed) that is allowed to vary from no effect when the tax is 0%. This analysis was not weighted and so Figure 2B should be used to give the best tax elasticity estimate. Chile results are indicated by a (red coloured) dash; other US results are indicated by black‐coloured diamonds, Mexico by orange squares, France by a blue triangle, Catalonia by a white circle, and Berkeley by green diamonds [Colour figure can be viewed at wileyonlinelibrary.com]

References

    1. Malik VS, Willett WC, Hu FB. Global obesity: trends, risk factors and policy implications. Nat Rev Endocrinol. 2013;9:13‐27. - PubMed
    1. Singh GM, Micha R, Khatibzadeh S, et al. Global, regional, and national consumption of sugar‐sweetened beverages, fruit juices, and milk: a systematic assessment of beverage intake in 187 countries. PLoS ONE. 2015;10(8):e0124845. 10.1371/journal.pone.0124845 - DOI - PMC - PubMed
    1. Malik VS, Popkin BM, Bray GA, Despres JP, Hu FB. Sugar‐sweetened beverages, obesity, type 2 diabetes mellitus, and cardiovascular disease risk. Circulation. 2010;121(11):1356‐1364. - PMC - PubMed
    1. Malik VS, Popkin BM, Bray GA, Despres JP, Willett WC, Hu FB. Sugar‐sweetened beverages and risk of metabolic syndrome and type 2 diabetes: a meta‐analysis. Diabetes Care. 2010;33(11):2477‐2483. - PMC - PubMed
    1. Imamura F, O'Connor L, Ye Z, et al. Consumption of sugar sweetened beverages, artificially sweetened beverages, and fruit juice and incidence of type 2 diabetes: systematic review, meta‐analysis, and estimation of population attributable fraction. BMJ. 2015;351:h3576. 10.1136/bmj.h3576 - DOI - PMC - PubMed

Publication types

MeSH terms