

Effects of Salmon Calcitonin on the Concentrations of Monoamines in Periaqueductal Gray in Formalin Test
- PMID: 31218879
- PMCID: PMC6711249
- DOI: 10.4274/balkanmedj.galenos.2019.2018.12.88
Effects of Salmon Calcitonin on the Concentrations of Monoamines in Periaqueductal Gray in Formalin Test
Abstract
Background: The receptors of salmon calcitonin, located on certain areas of the brain such as the periaqueductal gray matter, are responsible for pain modulation.
Aims: The effects of intracerebroventricular injection of salmon calcitonin on the behavioral response to pain and on the levels of monoamines in the periaqueductal gray were explored using a biphasic animal model of pain.
Study design: Animal experiment.
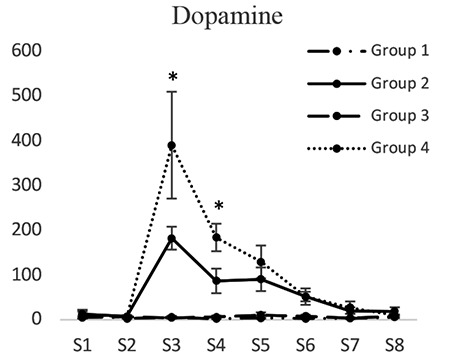
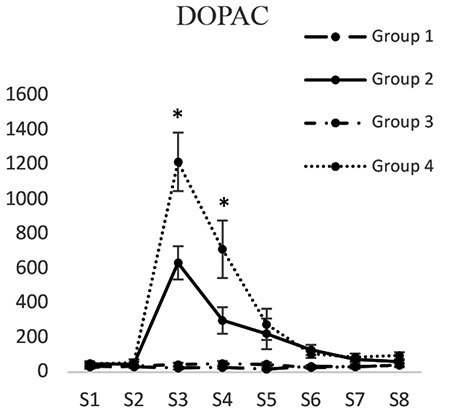
Methods: A total of 45 male rats were divided into four groups (n=6). Salmon calcitonin was injected into the lateral ventricle of the brain (1.5 nmol, with a volume of 5 μL). After 20 min, 2.5% formalin was subcutaneously injected into the right leg claw, and pain behavior was recorded on a numerical basis. At the time of the formalin test, the periaqueductal gray area was microdialized. High-performance liquid chromatography method was used to gauge the levels of monoamines and their metabolites.
Results: Intracerebroventricular injections of salmon calcitonin resulted in pain reduction in the formalin test (p<0.05). The dialysate concentrations of serotonin, dopamine, norepinephrine, 5-hydroxyindoleacetic acid, 3,4-dihydroxyphenylacetic, and 4-hydroxy-3-methoxyphenylglycol increased in the periaqueductal gray area in different phases of the formalin pain test (p<0.05).
Conclusion: Salmon calcitonin reduced pain by increasing the concentrations of monoamines and the metabolites derived from them in the periaqueductal gray area.
Keywords: formalin test; microdialysis; Chromatography; high-performance liquid; monoamine oxidase; salmon calcitonin.
Conflict of interest statement
Figures


Similar articles
-
The effect of intracerebroventricular injection of CGRP on pain behavioral responses and monoamines concentrations in the periaqueductal gray area in rat.Iran J Basic Med Sci. 2018 Apr;21(4):395-399. doi: 10.22038/IJBMS.2018.26384.6467. Iran J Basic Med Sci. 2018. PMID: 29796223 Free PMC article.
-
Effects of Intracerebroventricular and Intra-Arcuate Nucleus Injection of Ghrelin on Pain Behavioral Responses and Met-Enkephalin and β-Endorphin Concentrations in the Periaqueductal Gray Area in Rats.Int J Mol Sci. 2019 May 19;20(10):2475. doi: 10.3390/ijms20102475. Int J Mol Sci. 2019. PMID: 31109149 Free PMC article.
-
Calcitonin microinjection into the periaqueductal gray impairs contextual fear conditioning in the rat.Neurosci Lett. 1999 Nov 12;275(2):101-4. doi: 10.1016/s0304-3940(99)00749-1. Neurosci Lett. 1999. PMID: 10568509
-
Effects of fenfluramine combined with electroacupuncture on monoamine release in periaqueductal gray of rat brain.Zhongguo Yao Li Xue Bao. 1999 Jul;20(7):597-600. Zhongguo Yao Li Xue Bao. 1999. PMID: 10678120
-
Descending monoaminergic pain modulation: bidirectional control and clinical relevance.Neurology. 2008 Jul 15;71(3):217-21. doi: 10.1212/01.wnl.0000318225.51122.63. Neurology. 2008. PMID: 18625968 Review. No abstract available.
Cited by
-
Antinociceptive effects of gamma-linolenic acid in the formalin test in the rats.Ann Med Surg (Lond). 2024 Mar 25;86(5):2677-2683. doi: 10.1097/MS9.0000000000002001. eCollection 2024 May. Ann Med Surg (Lond). 2024. PMID: 38694379 Free PMC article.
-
The analgesic effects of insulin and its disorders in streptozotocin-induced short-term diabetes.Physiol Rep. 2024 Apr;12(8):e16009. doi: 10.14814/phy2.16009. Physiol Rep. 2024. PMID: 38639646 Free PMC article.
-
Effects of dimethyl itaconate on expressions of NGFI-A and NGFI-B and inflammatory cytokines in the spinal cord in the formalin test.Brain Commun. 2024 Nov 11;6(6):fcae397. doi: 10.1093/braincomms/fcae397. eCollection 2024. Brain Commun. 2024. PMID: 39568551 Free PMC article.
-
Beyond CGRP: The calcitonin peptide family as targets for migraine and pain.Br J Pharmacol. 2022 Feb;179(3):381-399. doi: 10.1111/bph.15605. Epub 2021 Jul 27. Br J Pharmacol. 2022. PMID: 34187083 Free PMC article. Review.
-
Calcitonin receptor, calcitonin gene-related peptide and amylin distribution in C1/2 dorsal root ganglia.J Headache Pain. 2024 Mar 14;25(1):36. doi: 10.1186/s10194-024-01744-z. J Headache Pain. 2024. PMID: 38481170 Free PMC article.
References
-
- Gebhart GF. Descending modulation of pain. Neuroscience & Biobehavioral Reviews. 2004;27:729–37. - PubMed
-
- Kwiat GC, Basbaum AI. Organization of tyrosine hydroxylase- and serotonin-immunoreactive brainstem neurons with axon collaterals to the periaqueductal gray and the spinal cord in the rat. Brain Res. 1990;528:83–94. - PubMed
-
- Fischer JA, Born W. Novel peptides from the calcitonin gene: expression, receptors and biological function. Peptides. 1985;6(Suppl 3):265–71. - PubMed
MeSH terms
Substances
LinkOut - more resources
Full Text Sources