. 2019 Sep;45(9):1248-1264.
doi: 10.1037/xhp0000668. Epub 2019 Jun 20.

Specifying the precision of guiding features for visual search

Affiliations

Specifying the precision of guiding features for visual search

Robert G Alexander et al. J Exp Psychol Hum Percept Perform. 2019 Sep.

Abstract

Visual search is the task of finding things with uncertain locations. Despite decades of research, the features that guide visual search remain poorly specified, especially in realistic contexts. This study tested the role of two features-shape and orientation-both in the presence and absence of hue information. We conducted five experiments to describe preview-target mismatch effects, decreases in performance caused by differences between the image of the target as it appears in the preview and as it appears in the actual search display. These mismatch effects provide direct measures of feature importance, with larger performance decrements expected for more important features. Contrary to previous conclusions, our data suggest that shape and orientation only guide visual search when color is not available. By varying the probability of mismatch in each feature dimension, we also show that these patterns of feature guidance do not change with the probability that the previewed feature will be invalid. We conclude that the target representations used to guide visual search are much less precise than previously believed, with participants encoding and using color and little else. (PsycINFO Database Record (c) 2019 APA, all rights reserved).


Figures

Figure 1
Figure 1
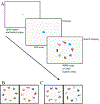
A) Examples of pig and traffic light stimuli at all 25 levels of orientation mismatch used in Experiment 1, and (B) all 25 levels of aspect ratio mismatch used in Experiment 2. Experiment 3 selectively used the “no change” condition; 30°, 60°, 90°, 120°, 150°, 180°, 210°, and 240° orientation-change levels; and 110%, 120%, 130%, 140%, 150%, 160%, 170%, and 180% aspect-ratio-change levels.
Figure 2
Figure 2
A) Example trial sequence for an orientation-change trial (Experiment 1). Example search displays from the (B) color and (C) grayscale conditions.
Figure 3
Figure 3
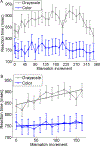
A) Experiment 1 RT varied across orientation mismatch levels in the grayscale condition but not in the color condition. B) Experiment 1 RT collapsed over clockwise and counterclockwise orientation mismatch. Best-fit lines indicate a linear increase in RTs with increasing mismatch in the grayscale condition (0.41msec/°), but not in the color condition (0.09msec/°). Error bars indicate one standard error of the mean (SEM).
Figure 4
Figure 4
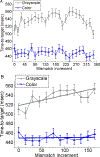
A) Experiment 1 target guidance, as measured by time-to-target, was affected by orientation mismatch only in the absence of hue information. B) Time-to-target collapsed over clockwise and counterclockwise orientation mismatch, more clearly showing an effect of orientation mismatch only in the grayscale condition. The best-fit lines in panel B indicate a linear increase in time-to-target with increasing mismatch in the grayscale condition (0.22msec/°) but not for color (0.01msec/°). Error bars indicate one SEM.
Figure 5
Figure 5
A) Verification time varied across orientation mismatch levels in the Experiment 1 grayscale condition, but not the color condition. B) Verification data collapsed across clockwise and counterclockwise orientation mismatch, which shows a linear relationship between verification time and orientation mismatch most clearly in the grayscale condition (grayscale best-fit line = 0.19msec/°; color best-fit line = 0.08msec/°). Error bars indicate one SEM.
Figure 6
Figure 6
Manual RT increased with increasing shape mismatch in the grayscale condition of Experiment 2, but did not vary with shape mismatch in the color condition. The best-fit line for the grayscale data had a slope of 0.24msec/%, but this slope was only 0.01msec/% for the color data. Error bars indicate one SEM. Unlike orientation, aspect ratio is not a circular feature space and therefore the mismatch levels are not presented in collapsed form.
Figure 7
Figure 7
Time-to-target varied across shape mismatch levels in the grayscale condition of Experiment 2, but not the color condition. Best-fit lines indicate an increase of 0.10 msec/% across mismatch levels in the grayscale condition, but only a 0.02 msec/% increase across levels in the color condition. Error bars indicate one SEM.
Figure 8
Figure 8
Experiment 2 verification times did not change with mismatch in the color condition (decreasing by 0.01 msec/%, by best fit line), but significantly increased with mismatch in the grayscale condition (0.14 msec/%). Error bars indicate one SEM.
Figure 9
Figure 9
Experiment 3 RTs increased with increasing mismatch for both the orientation and shape manipulations. Error bars indicate one SEM.
Figure 10
Figure 10
Experiment 3 time-to-target increased with increasing mismatch for both the orientation and shape manipulations. Error bars indicate one SEM.
Figure 11
Figure 11
Experiment 3 verification time increased with increasing mismatch for both the orientation and aspect ratio manipulations. Error bars indicate one SEM.
Figure 12
Figure 12
A) Time-to-target varied across orientation mismatch levels in Experiment 1 (grayscale condition) and Experiment 3, and (B) across shape mismatch levels in Experiment 2 (grayscale condition) and Experiment 3. Error bars indicate one SEM.

References

    1. Adeli H, Vitu F, & Zelinsky GJ (2017). A Model of the Superior Colliculus Predicts Fixation Locations during Scene Viewing and Visual Search. The Journal of Neuroscience, 37(6), 1453 10.1523/jneurosci.0825-16.2016 - DOI - PMC - PubMed
    1. Alexander RG, Schmidt J, & Zelinsky GJ (2014). Are summary statistics enough? Evidence for the importance of shape in guiding visual search. Visual Cognition, 22(3–4), 595–609. 10.1080/13506285.2014.890989 - DOI - PMC - PubMed
    1. Alexander RG, & Zelinsky GJ (2011). Visual Similarity Effects in Categorical Search. Journal of Vision, 11(8), 9 10.1167/11.8.9 - DOI - PMC - PubMed
    1. Alexander RG, & Zelinsky GJ (2012). Effects of part-based similarity on visual search: The Frankenbear experiment. Vision Research, 54, 20–30. 10.1016/j.visres.2011.12.004 - DOI - PMC - PubMed
    1. Alexander RG, & Zelinsky GJ (2018). Occluded Information is Restored at Preview but not During Visual Search. Journal of Vision, 11(4), 1–16. 10.1167/18.11.4 - DOI - PMC - PubMed