

Deep brain stimulation has state-dependent effects on motor connectivity in Parkinson's disease
- PMID: 31219504
- PMCID: PMC7053573
- DOI: 10.1093/brain/awz164
Deep brain stimulation has state-dependent effects on motor connectivity in Parkinson's disease
Abstract
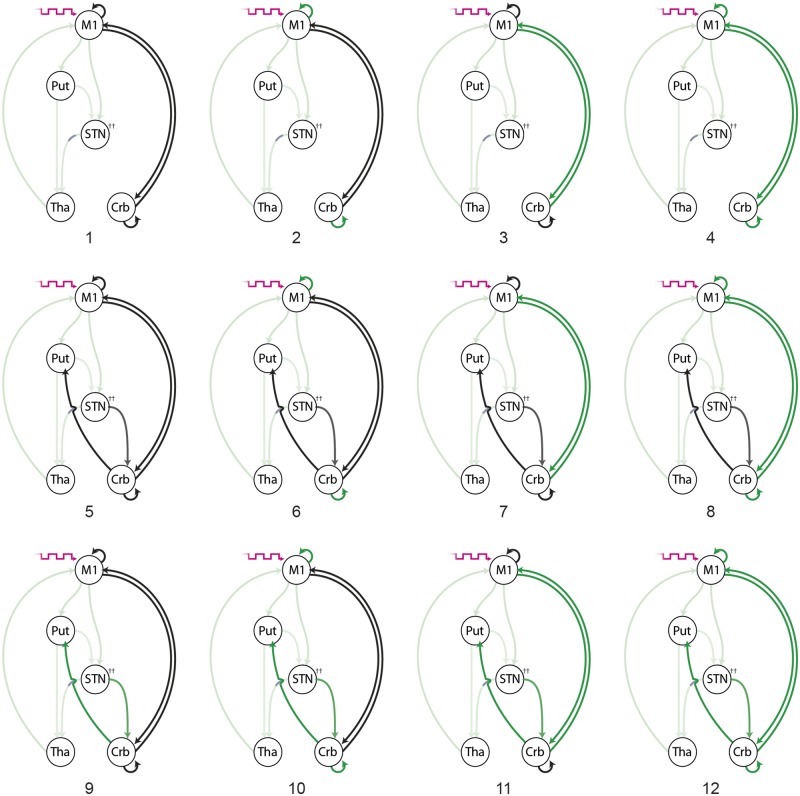
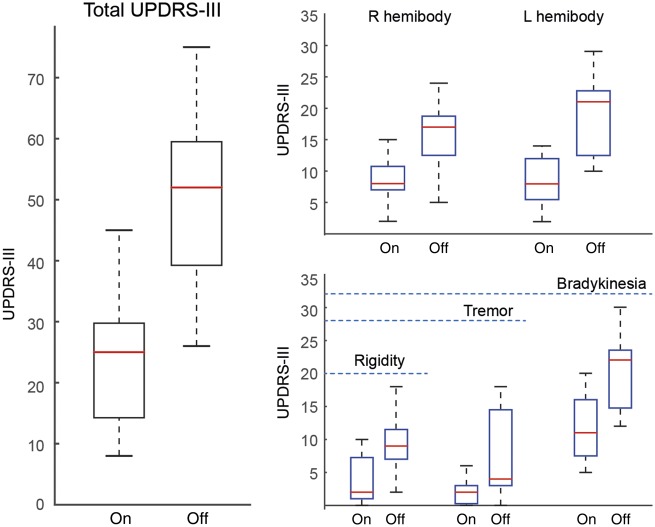
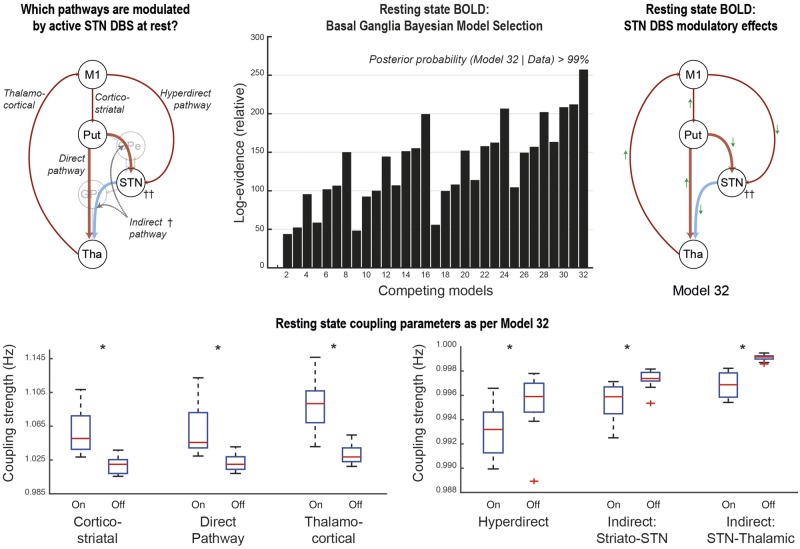
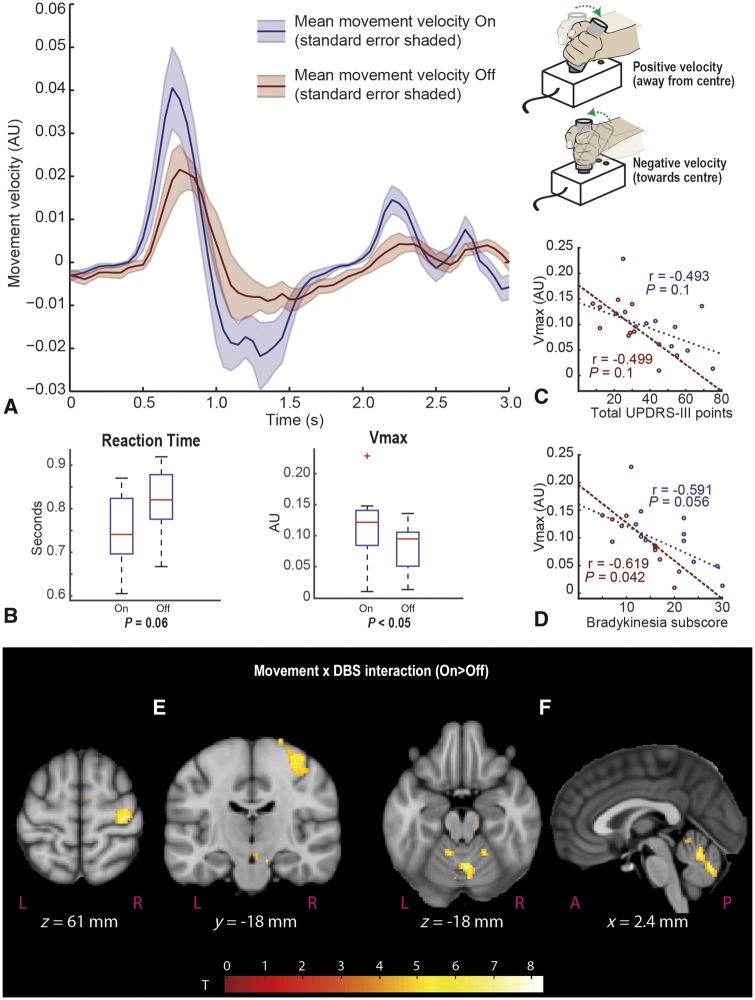
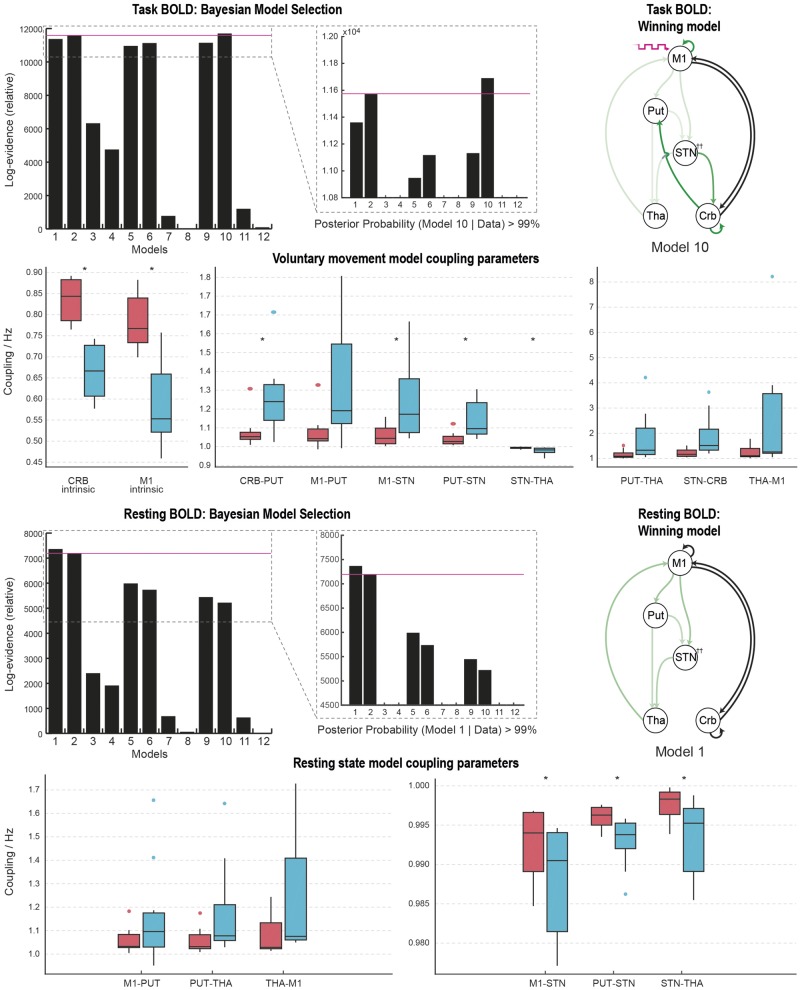
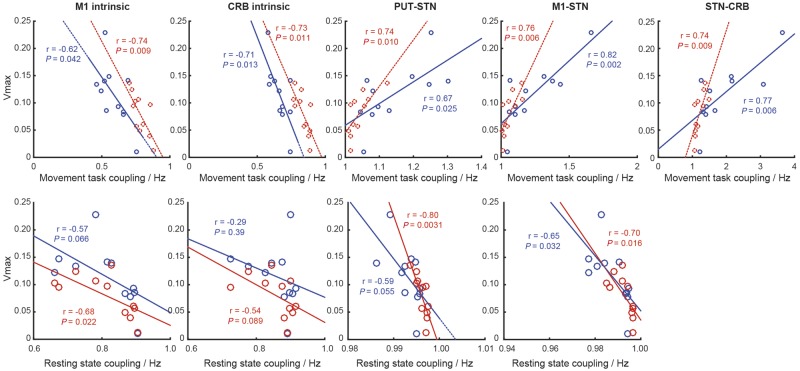
Subthalamic nucleus deep brain stimulation is an effective treatment for advanced Parkinson's disease; however, its therapeutic mechanism is unclear. Previous modelling of functional MRI data has suggested that deep brain stimulation has modulatory effects on a number of basal ganglia pathways. This work uses an enhanced data collection protocol to collect rare functional MRI data in patients with subthalamic nucleus deep brain stimulation. Eleven patients with Parkinson's disease and subthalamic nucleus deep brain stimulation underwent functional MRI at rest and during a movement task; once with active deep brain stimulation, and once with deep brain stimulation switched off. Dynamic causal modelling and Bayesian model selection were first used to compare a series of plausible biophysical models of the cortico-basal ganglia circuit that could explain the functional MRI activity at rest in an attempt to reproduce and extend the findings from our previous work. General linear modelling of the movement task functional MRI data revealed deep brain stimulation-associated signal increases in the primary motor and cerebellar cortices. Given the significance of the cerebellum in voluntary movement, we then built a more complete model of the motor system by including cerebellar-basal ganglia interactions, and compared the modulatory effects deep brain stimulation had on different circuit components during the movement task and again using the resting state data. Consistent with previous results from our independent cohort, model comparison found that the rest data were best explained by deep brain stimulation-induced increased (effective) connectivity of the cortico-striatal, thalamo-cortical and direct pathway and reduced coupling of subthalamic nucleus afferent and efferent connections. No changes in cerebellar connectivity were identified at rest. In contrast, during the movement task, there was functional recruitment of subcortical-cerebellar pathways, which were additionally modulated by deep brain stimulation, as well as modulation of local (intrinsic) cortical and cerebellar circuits. This work provides in vivo evidence for the modulatory effects of subthalamic nucleus deep brain stimulation on effective connectivity within the cortico-basal ganglia loops at rest, as well as further modulations in the cortico-cerebellar motor system during voluntary movement. We propose that deep brain stimulation has both behaviour-independent effects on basal ganglia connectivity, as well as behaviour-dependent modulatory effects.
Keywords: Parkinson’s disease; basal ganglia; connectivity; deep brain stimulation; functional MRI.
© The Author(s) (2019). Published by Oxford University Press on behalf of the Guarantors of Brain. All rights reserved. For permissions, please email: journals.permissions@oup.com.
Figures
Similar articles
-
Deep brain stimulation induced normalization of the human functional connectome in Parkinson's disease.Brain. 2019 Oct 1;142(10):3129-3143. doi: 10.1093/brain/awz239. Brain. 2019. PMID: 31412106
-
Resting state functional MRI in Parkinson's disease: the impact of deep brain stimulation on 'effective' connectivity.Brain. 2014 Apr;137(Pt 4):1130-44. doi: 10.1093/brain/awu027. Epub 2014 Feb 24. Brain. 2014. PMID: 24566670 Free PMC article.
-
Changes in Functional Connectivity Relate to Modulation of Cognitive Control by Subthalamic Stimulation.Hum Brain Mapp. 2024 Dec 1;45(17):e70095. doi: 10.1002/hbm.70095. Hum Brain Mapp. 2024. PMID: 39655402 Free PMC article.
-
[Emotion and basal ganglia (II): what can we learn from subthalamic nucleus deep brain stimulation in Parkinson's disease?].Rev Neurol (Paris). 2012 Aug-Sep;168(8-9):642-8. doi: 10.1016/j.neurol.2012.06.012. Epub 2012 Aug 17. Rev Neurol (Paris). 2012. PMID: 22901366 Review. French.
-
New insights into cortico-basal-cerebellar connectome: clinical and physiological considerations.Brain. 2020 Feb 1;143(2):396-406. doi: 10.1093/brain/awz310. Brain. 2020. PMID: 31628799 Review.
Cited by
-
Effectiveness of deep brain stimulation in Parkinson's disease treatment with Single-center experience in Pakistan.Pak J Med Sci. 2023 Jul-Aug;39(4):1018-1023. doi: 10.12669/pjms.39.4.7680. Pak J Med Sci. 2023. PMID: 37492334 Free PMC article.
-
Use of Functional MRI in Deep Brain Stimulation in Parkinson's Diseases: A Systematic Review.Front Neurol. 2022 Mar 23;13:849918. doi: 10.3389/fneur.2022.849918. eCollection 2022. Front Neurol. 2022. PMID: 35401406 Free PMC article.
-
Subthalamic stimulation evokes hyperdirect high beta interruption and cortical high gamma entrainment in Parkinson's disease.NPJ Parkinsons Dis. 2025 Apr 26;11(1):95. doi: 10.1038/s41531-025-00965-6. NPJ Parkinsons Dis. 2025. PMID: 40287435 Free PMC article.
-
On the Use of TMS to Investigate the Pathophysiology of Neurodegenerative Diseases.Front Neurol. 2020 Nov 3;11:584664. doi: 10.3389/fneur.2020.584664. eCollection 2020. Front Neurol. 2020. PMID: 33224098 Free PMC article. Review.
-
Stimulating at the right time to recover network states in a model of the cortico-basal ganglia-thalamic circuit.PLoS Comput Biol. 2022 Mar 4;18(3):e1009887. doi: 10.1371/journal.pcbi.1009887. eCollection 2022 Mar. PLoS Comput Biol. 2022. PMID: 35245281 Free PMC article.
References
-
- Albin RL, Young AB, Penney JB. The functional anatomy of basal ganglia disorders. Trends Neurosci. 1989; 12: 366–75. - PubMed
-
- Andersson JL, Hutton C, Ashburner J, Turner R, Friston K. Modeling geometric deformations in EPI time series. Neuroimage 2001; 13: 903–19. - PubMed
-
- Behrens TEJ, Johansen-Berg H, Woolrich MW, Smith SM, Wheeler-Kingshott CAM, Boulby PA et al. . Non-invasive mapping of connections between human thalamus and cortex using diffusion imaging. Nat Neurosci 2003; 6: 750–57. - PubMed
-
- Beurrier C, Bioulac B, Audin J, Hammond C. High-frequency stimulation produces a transient blockade of voltage-gated currents in subthalamic neurons. J Neurophysiol 2001; 85: 1351–6. - PubMed
Publication types
MeSH terms
Grants and funding
LinkOut - more resources
Full Text Sources
Medical
