. 2019 Jul 1;142(7):2082-2095.
doi: 10.1093/brain/awz136.

Longitudinal neuroanatomical and cognitive progression of posterior cortical atrophy

Affiliations

Longitudinal neuroanatomical and cognitive progression of posterior cortical atrophy

Nicholas C Firth et al. Brain. .

Abstract

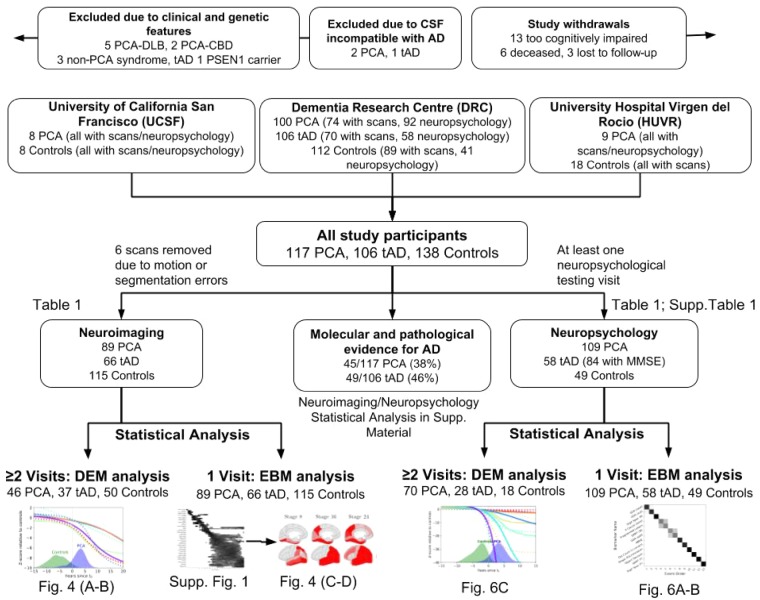
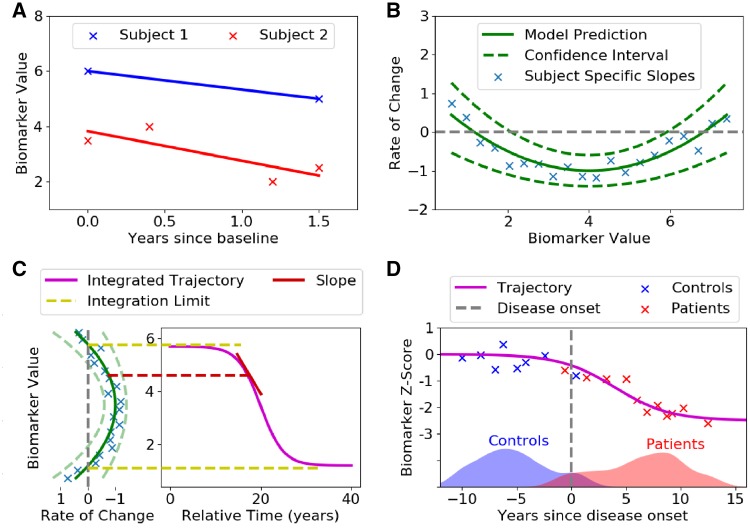
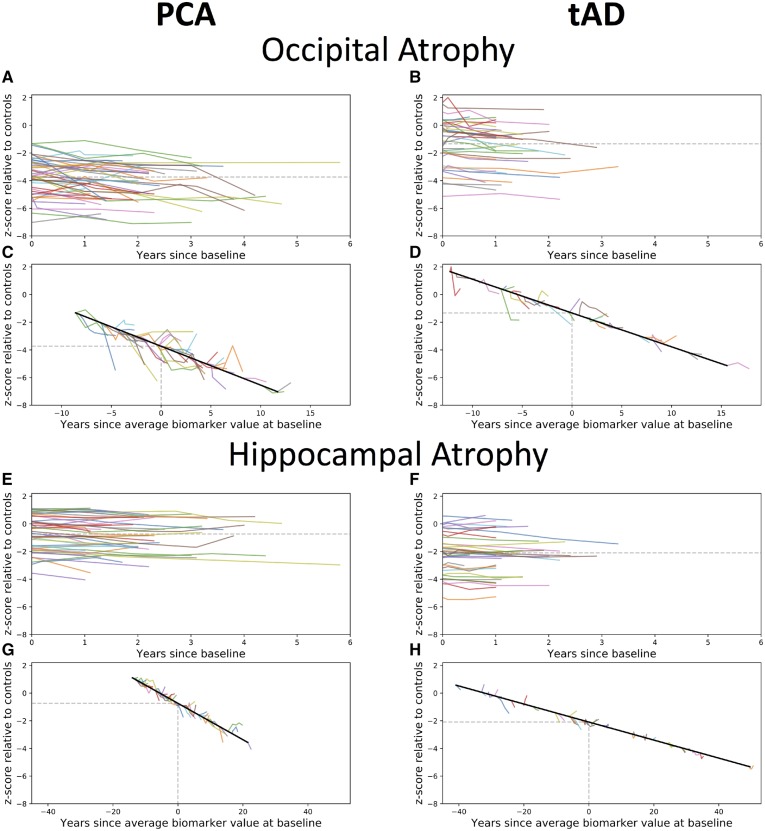
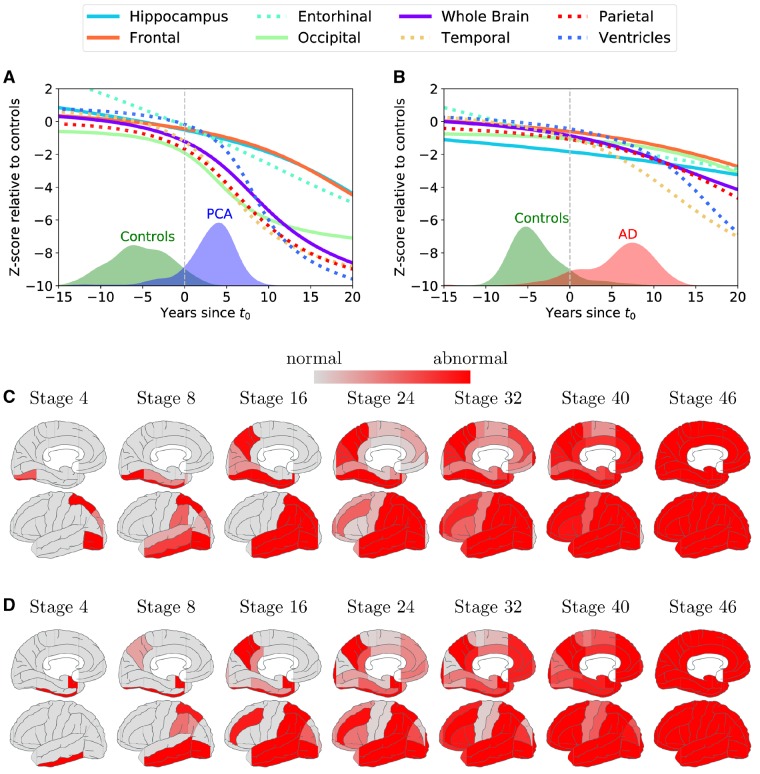
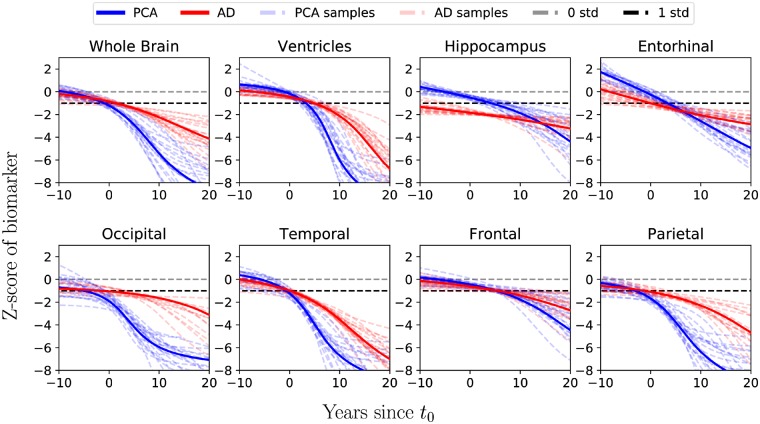
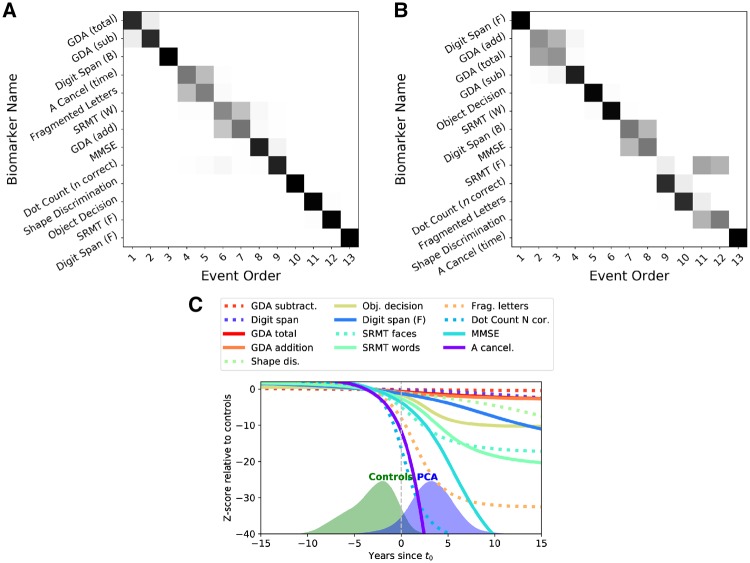
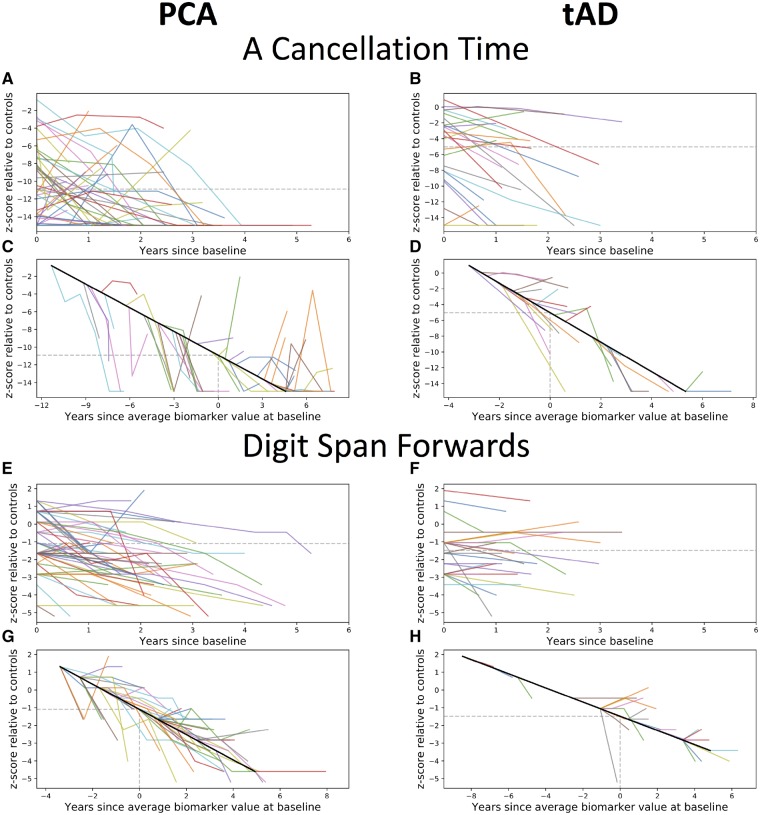
Posterior cortical atrophy is a clinico-radiological syndrome characterized by progressive decline in visual processing and atrophy of posterior brain regions. With the majority of cases attributable to Alzheimer's disease and recent evidence for genetic risk factors specifically related to posterior cortical atrophy, the syndrome can provide important insights into selective vulnerability and phenotypic diversity. The present study describes the first major longitudinal investigation of posterior cortical atrophy disease progression. Three hundred and sixty-one individuals (117 posterior cortical atrophy, 106 typical Alzheimer's disease, 138 controls) fulfilling consensus criteria for posterior cortical atrophy-pure and typical Alzheimer's disease were recruited from three centres in the UK, Spain and USA. Participants underwent up to six annual assessments involving MRI scans and neuropsychological testing. We constructed longitudinal trajectories of regional brain volumes within posterior cortical atrophy and typical Alzheimer's disease using differential equation models. We compared and contrasted the order in which regional brain volumes become abnormal within posterior cortical atrophy and typical Alzheimer's disease using event-based models. We also examined trajectories of cognitive decline and the order in which different cognitive tests show abnormality using the same models. Temporally aligned trajectories for eight regions of interest revealed distinct (P < 0.002) patterns of progression in posterior cortical atrophy and typical Alzheimer's disease. Patients with posterior cortical atrophy showed early occipital and parietal atrophy, with subsequent higher rates of temporal atrophy and ventricular expansion leading to tissue loss of comparable extent later. Hippocampal, entorhinal and frontal regions underwent a lower rate of change and never approached the extent of posterior cortical involvement. Patients with typical Alzheimer's disease showed early hippocampal atrophy, with subsequent higher rates of temporal atrophy and ventricular expansion. Cognitive models showed tests sensitive to visuospatial dysfunction declined earlier in posterior cortical atrophy than typical Alzheimer's disease whilst tests sensitive to working memory impairment declined earlier in typical Alzheimer's disease than posterior cortical atrophy. These findings indicate that posterior cortical atrophy and typical Alzheimer's disease have distinct sites of onset and different profiles of spatial and temporal progression. The ordering of disease events both motivates investigation of biological factors underpinning phenotypic heterogeneity, and informs the selection of measures for clinical trials in posterior cortical atrophy.

Keywords: Alzheimer’s disease; brain atrophy; dementia; memory; structural MRI.


Figures

Figure 1
Figure 1
Study flow chart showing participants included and excluded from analyses. Study participants were recruited from three different centres from the Dementia Research Centre (DRC), University of California San Francisco (UCSF) and University Hospital Virgen del Rocio (HUVR). Of all the study participants, some underwent neuroimaging (Table 1) and neuropsychological testing (Table 1 and Supplementary Table 1). We performed statistical analysis both longitudinally, using the differential equation model (DEM) and cross-sectionally, using the EBM. Full results are also shown in the Supplementary material on the subset of patients with molecular and pathological evidence of Alzheimer’s disease pathology. AD = Alzheimer’s disease; tAD = typical Alzheimer’s disease; DLB = dementia with Lewy bodies; CBD = corticobasal degeneration; MMSE = Mini-Mental State Examination.
Figure 2
Figure 2
Diagram of the differential equation model. (A) Measuring biomarker rate of change from line of best fit. The biomarker measurements for each subject were plotted against time since baseline, and a line was fit for each subject independently. The slope of these lines was then used as a measure of the biomarker rate of change. (B) Rate of change model. The slopes of each fitted line were plotted against the average biomarker value of each subject (blue crosses). A non-parametric model (Gaussian process regression, green line) was then fitted on measurements, which gave a model prediction and also a 95% confidence interval. (C) Trajectory reconstruction. A line integral was performed on the rate of change model from B. The integration limits were defined as the biomarker values where the corresponding change is zero or at the limits of the data. Starting from the upper integration limit, the trajectory was reconstructed from the rate of change prediction, which represents the slope corresponding to that biomarker value. Before integration, an arbitrary starting time point, t0 = 0, was defined, thus all time is relative to t0. (D) Anchoring process. In the absence of a reliable estimate of time since disease onset, the origin t0 was set as the point that best separates controls from patients, which have been staged along the time axis using their biomarker data. Moreover, to make trajectories comparable across biomarkers we convert the biomarker values to Z-scores with respect to controls, which results in a scaling along the y-axis. The process (AD) was repeated for each biomarker independently. After fitting each biomarker, the subjects can be staged along the disease timeline, as in (D), using the trajectories from all biomarkers.
Figure 3
Figure 3
Observed longitudinal occipital (A–D) and hippocampal (E–H) atrophy, relative to controls, for PCA (left) and typical Alzheimer’s disease patients (right). (AB and EF) Spaghetti plots anchored at baseline visit. (CD and GH) Hairy line plots for observed longitudinal data anchored to the group trajectory using the baseline value. tAD = typical Alzheimer’s disease.
Figure 4
Figure 4
Region of interest trajectories and ordering of atrophy. (A and B) Trajectories of different region of interest volumes from the DEM for (A) PCA progression and (B) typical Alzheimer’s disease (AD) progression. The x-axis shows the number of years since t0, and the y-axis shows the Z-score of the region of interest volume relative to controls. The trajectories of the ventricles have been flipped to aid comparison. Overlaid are histograms of subject stages based on the estimated trajectories. (C and D) Ordering of atrophy in (C) PCA patients and (D) typical Alzheimer’s disease patients according to the EBM. White regions are within the volume range of healthy controls, while red regions are abnormal by the corresponding stage, with shading indicating the probability of abnormality. By stage k, a number of k biomarkers shaded in red became abnormal. For positional variance diagrams used to generate brain figures and full details on methodology, see the Supplementary material.
Figure 5
Figure 5
Mean trajectories for region of interest volumes for PCA and typical Alzheimer’s disease aligned on the same temporal scale with samples from the posterior distribution showing the confidence of the mean trajectory. The x-axis shows the number of years since t0, and the y-axis shows the z-score of the region of interest volume relative to controls. The trajectories for the ventricles have been flipped to aid visual comparison. AD = Alzheimer’s disease.
Figure 6
Figure 6
(A and B) Positional variance diagrams for (A) PCA and (B) typical Alzheimer’s disease showing estimated order of impairment on 14 cognitive metrics (y-axis) across different stages (positions on x-axis). Each entry (x,y) represents the probability of a particular cognitive metric becoming abnormal at a given position in the sequence (darker shades = higher probability). (C) Trajectories of different cognitive tests from the differential equation model for PCA progression. The x-axis shows the number of years since t0, and the y-axis shows the z-score on each cognitive test relative to controls. Overlaid are also the histograms of the subjects, as they have been staged by the model.
Figure 7
Figure 7
Observed longitudinal data from example cognitive tasks. Observed longitudinal A cancellation (AD) and digit span forwards (EH) scores, relative to controls, for PCA (left) and typical Alzheimer’s disease patients (right). (AB and EF) Spaghetti plots anchored at baseline visit. (CD and GH) Hairy line plots for observed longitudinal data anchored to the group trajectory using the baseline value. tAD = typical Alzheimer’s disease.

References

    1. Benson DF, Davis RJ, Snyder BD. Posterior cortical atrophy. Arch Neurol 1988; 45: 789–93. - PubMed
    1. Cardoso MJ, Wolz R, Modat M, Fox NC, Rueckert D, Ourselin S. Geodesic information flows. Med Image Comput Comput-Assist Interv MICCAI Int Conf Med Image Comput Comput-Assist Interv 2012; 15: 262–70. - PubMed
    1. Chang Z, Lichtenstein P, Larsson H, Fazel S. Substance use disorders, psychiatric disorders, and mortality after release from prison: a nationwide longitudinal cohort study. Lancet Psychiatry 2015; 2: 422–30. - PMC - PubMed
    1. Crutch SJ, Lehmann M, Schott JM, Rabinovici GD, Rossor MN, Fox NC. Posterior cortical atrophy. Lancet Neurol 2012; 11: 170–8. - PMC - PubMed
    1. Crutch SJ, Schott JM, Rabinovici GD, Murray M, Snowden JS, van der Flier WM, et al.Consensus classification of PCA. Alzheimers Dement 2017; 13: 870–84. - PMC - PubMed

Publication types