. 2019 Oct;58(10):1770-1782.
doi: 10.1002/mc.23064. Epub 2019 Jun 10.

Activation of Wnt signaling promotes olaparib resistant ovarian cancer

Affiliations

Activation of Wnt signaling promotes olaparib resistant ovarian cancer

Tomomi M Yamamoto et al. Mol Carcinog. 2019 Oct.

Abstract

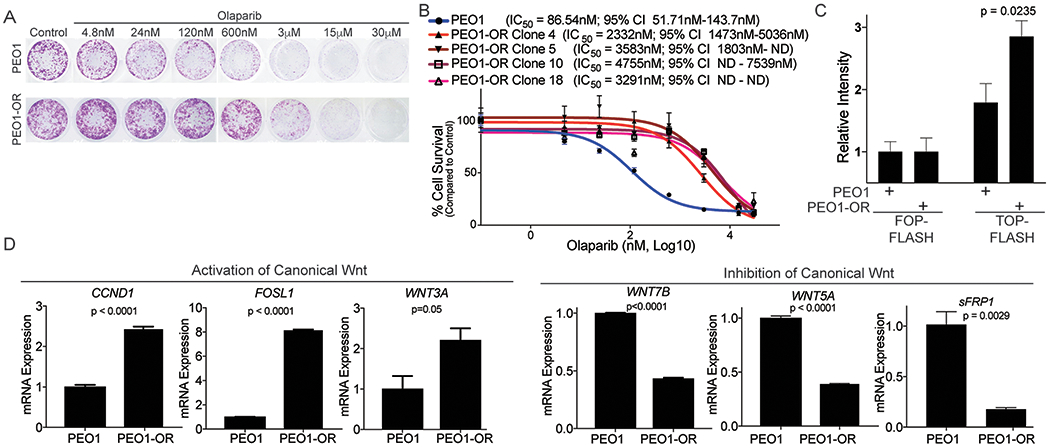
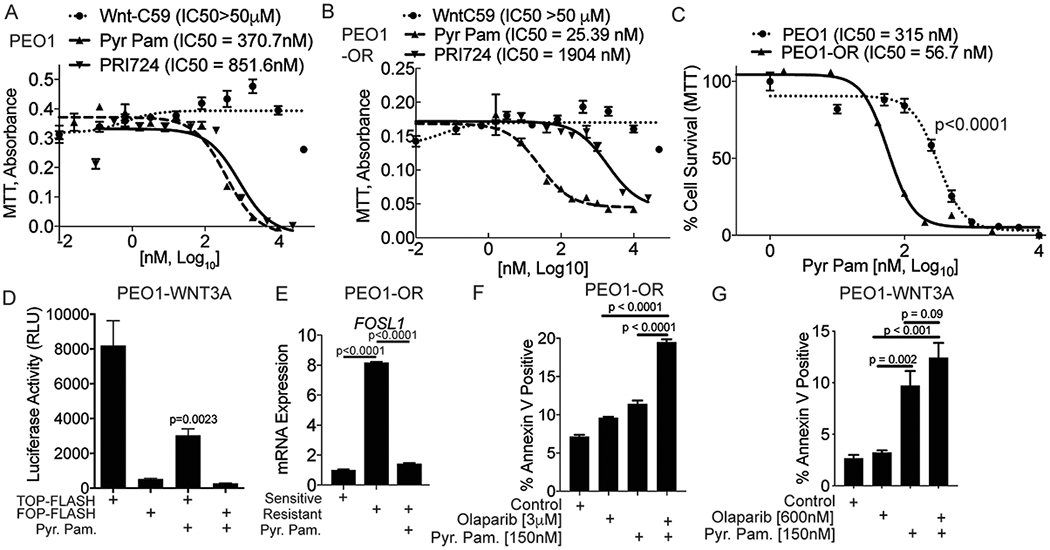
Epithelial ovarian cancer (EOC) has one of the highest death to incidence ratios among all cancers. High grade serous ovarian carcinoma (HGSOC) is the most common and deadliest EOC histotype due to the lack of therapeutic options following debulking surgery and platinum/taxane-based chemotherapies. For recurrent chemosensitive HGSOC, poly(ADP)-ribose polymerase inhibitors (PARPi; olaparib, rucaparib, or niraparib) represent an emerging treatment strategy. While PARPi are most effective in homologous recombination DNA repair-deficient (HRD) HGSOCs, recent studies have observed a significant benefit in non-HRD HGSOCs. However, all HGSOC patients are likely to acquire resistance. Therefore, there is an urgent clinical need to understand PARPi resistance and to introduce novel combinatorial therapies to manage PARPi resistance and extend HGSOC disease-free intervals. In a panel of HGSOC cell lines, we established matched olaparib sensitive and resistant cells. Transcriptome analysis of the matched olaparib-sensitive vs -resistant cells revealed activation of the Wnt signaling pathway and consequently increased TCF transcriptional activity in PARPi-resistant cells. Forced activation of canonical Wnt signaling in several PARPi-sensitive cells via WNT3A reduced olaparib and rucaparib sensitivity. PARPi resistant cells were sensitive to inhibition of Wnt signaling using the FDA-approved compound, pyrvinium pamoate, which has been shown to promote downregulation of β-catenin. In both an HGSOC cell line and a patient-derived xenograft model, we observed that combining pyrvinium pamoate with olaparib resulted in a significant decrease in tumor burden. This study demonstrates that Wnt signaling can mediate PARPi resistance in HGSOC and provides a clinical rationale for combining PARP and Wnt inhibitors.

Keywords: DNA repair; PARP inhibitor; ovarian cancer; therapy resistance; wnt signaling.


Conflict of interest statement

Competing financial interests: The authors declare no competing financial interests.

Figures

Figure 1.
Figure 1.. Olaparib resistant high grade serous ovarian cancer cells have increased Wnt activation.
A) PEO1 (TP53 and BRCA2-mutated) were treated in a step-wise fashion with increasing doses of olaparib. PEO1 sensitive and resistant (PEO1-OR) cells were plated in a 24-well plate and treated with increasing doses of olaparib for 12 days. Cells were stained with crystal violet. B) Four clonal olaparib resistant populations were established and olaparib resistance was confirmed with a dose response colony formation assay. Dose response curves are graphed and IC50 with 95% confidence interval indicated. C) PEO1 and PEO1-OR were transfected with TCF transcriptional reporter (TOP-FLASH) or a control reporter (FOP-FLASH). Luciferase activity was measured. D) RNA from PEO1 and PEO1-OR was extracted and utilized for a quantitative reverse-transcriptase PCR (qRT-PCR) against CCND1, FOSL1, WNT3A, WNT7B, WNT5A, and SFRP1. Beta-2-microglobulin (B2M) was used as an internal control. Experiments performed in triplicate. Statistical test used to calculate p-values, unpaired two-tailed t-test. Error bars = SEM.
Figure 2.
Figure 2.. Activation of Wnt signaling contributes to olaparib resistance.
A) PEO1 cells were transduced with either lentiviral control (Control) or a construct specific for WNT3A. mRNA expression of WNT3A was evaluated in PEO1-Control and PEO1-WNT3A. Beta-2-microglobulin (B2M) was used as an internal control. B) Same as A, but protein was extracted, separated on a SDS-PAGE, and immunoblotted against WNT3A. Loading control = β-actin. Densitometry was performed on WNT3A blot by normalizing to β-actin C) PEO1 control or PEO1-WNT3A cells were transfected with a TCF reporter (TOP-FLASH) and control (FOP-FLASH). 72 hours after TOP/FOP-FLASH transfection luciferase activity was measured. D) RNA was extracted from PEO1 control and PEO1-WNT3A cells and used for qRT-PCR against FOSL1 and CCND1. B2M was used as an internal control. E) PEO1 control and PEO1-WNT3A cells were plated in a 24-well plate, treated with increasing dose of olaparib for 12 days, and remaining cells were stained with crystal violet. F) Same as E, quantification of crystal violet staining. G) PEO1 control and PEO1-WNT3A single suspensions were plated onto growth factor reduced matrigel, treated with increasing dose of olaparib, and cultured for 12 days. H) Same as G, acini diameter was measured and graphed as a percent of vehicle control. Experiments performed in triplicate. Statistical test used to calculate p-values, unpaired two-tailed t-test or ANOVA. Error bars = SEM.
Figure 3.
Figure 3.. Pyrvinium pamoate significantly inhibits cell viability and synergizes with olaparib to induce apoptosis in PEO1-OR cells.
A) PEO1 cells were treated with increasing doses of three different Wnt inhibitors (Wnt-C59, Pyr. Pam., and PRI724). Cells were treated for 48 hours and a MTT assay was used to examine changes in cell viability. IC50 values are indicated for each inhibitor. B) Same as A, but used PEO1-OR cells. C) PEO1 and PEO1-OR were incubated for 48 hours with increasing doses of Pyr. Pam. and a MTT assay was used to examine changes in cell viability. IC50 values indicated. D) PEO1-WNT3A cells were transfected with a TCF reporter (TOP-FLASH) and control (FOP-FLASH). Cells were treated with Pyr. Pam. (370 nM) and luciferase activity was measured. E) PEO1-OR cells were treated with vehicle control or Pyr. Pam. (370 nM) and compared to untreated PEO1 cells. RNA was extracted and RT-qPCR was performed against FOSL1. B2M was used as an internal control. P-values calculated with ANOVA. F) PEO1-OR cells were treated with vehicle control (DMSO), olaparib (3 μM), Pyr. Pam. (150 nM), or in combination. Cells were treated for 72 hours and subjected to an apoptosis assay (AnnexinV-positive). G) Same as F, but examined PEO1-WNT3A cells. Experiments performed in triplicate. Unless noted, statistical test used to calculate p-values, unpaired two tailed t-test. Error bars = SEM.
Figure 4.
Figure 4.. PEO1-OR cells have increased DNA repair capacity, which is inhibited by Pyr. Pam.
A) PEO1 and PEO1-OR cells treated with vehicle control or olaparib (3 μM) for 72 hours and a single cell suspension was fixed in agarose. Fixed cells were subjected to electrophoresis and DNA was labeled. Representative images of cells. B) Same as A, DNA tails (at least 100 cells) were measured with ImageJ and graphed as tail moment. C) PEO1, PEO1-OR, and PEO1-WNT3A cells were irradiated (5 Gy) and incubated for the indicated time. Protein was extracted, separated by a SDS-PAGE, and immunoblotted against of serine 139 phosphorylated histone H2x (γH2Ax). Loading control = β-actin. D) Densitometric analysis of C. Relative γH2Ax levels calculated based on β-actin levels graphed over time analyzed with a linear regression. The slopes are graphed with standard error. E) Two-plasmid functional assay performed to assess distal non-homologous end joining. PEO1 and PEO1-OR clones were stably transfected with pimEJ5GFP and subsequently transfected with I-SceI restriction enzyme. After 72 hours, transfected cells were collected and examined via a flow cytometer to quantify GFP positive cells. Representative gating strategy is shown. F) Quantification of E. P-values calculated with ANOVA. G) Same as F, but utilized pDR-GFP to measure homology directed repair in PEO1 and PEO1-OR clones. P-values calculated with ANOVA. H) PEO1-OR clone 4 (C4) cells were treated with Pyr. Pam. (150 nM) 24 hours after I-SceI transfection and distal NHEJ assessed. I) PEO1-OR clone 4 cells were treated with Pyr. Pam (+ 150 nM and ++ 370 nM) 24 hours after I-SceI transfection and HR assessed. Experiments performed in triplicate. Unless noted statistical test used to calculate p-values, unpaired two tailed t-test. Error bars = SEM.
Figure 5.
Figure 5.. Combination of olaparib and Pyr. Pam. significantly inhibited HGSOC tumor progression.
A) A primary high grade serous ovarian cancer was utilized for ex vivo culture. Tumor sections were tagged with a secreted luciferase and subsequently treated with olaparib and Pyr. Pam. for 48 hours. Cell culture media was refreshed and luciferase activity was measured after 4 hours. B) GFP/luciferase PEO1-WNT3A cells were injected into the intraperitoneal cavity of immunocompromised mice. Tumors were allowed to establish for 4 weeks. Mice were imaged and randomized based on luminescence intensity on Day 0. Mice were treated daily for 21 days with vehicle control (n = 9), olaparib (n = 9, 50 mg/kg), Pyr. Pam. (n = 10, 0.5 mg/kg), and olaparib/Pyr. Pam. (n = 9, 0.5 mg/kg). Mice were imaged twice a week. Mice were imaged and sacrificed on Day 22. The rate of luminescence change over the course of treatment graphed. C) Images of tumors derived from all groups. Scale bar = 1 cm. D) The weight of total tumor burden indicated as tumor weight. E) The number of tumor nodules from each group. F) Immunohistochemical (IHC) analysis of treated tumors from (B) against Ki67, Cleaved (Cl.) caspase 3, and β-catenin. Representative images of consecutive images. Scale bar = 100 micron. G) Histology score (% of section x intensity) for Ki67 H) Same as G, but for Cl. Caspase 3. I) Same as G, but for β−catenin. J) Olaparib resistant PDX tumor cells were i.p. injected into NSG mice and tumors were allowed to establish for 2 weeks. Mice were treated daily for 21 days with vehicle control (n = 10), olaparib (n = 10, 50 mg/kg), Pyr. Pam. (n = 10, 0.5 mg/kg), and olaparib/Pyr. Pam. (n = 10, 0.5 mg/kg). The volume of tumor cells isolated from peritoneal cavity was quantified. Statistical test used to calculate p-values, Analysis of variance (ANOVA). Error bars = SEM.

Similar articles

Cited by

References

    1. Siegel RL, Miller KD, Jemal A. Cancer statistics, 2018. CA Cancer J Clin 2018;68:7–30 - PubMed
    1. Bitler BG, Watson ZL, Wheeler LJ, Behbakht K. PARP inhibitors: Clinical utility and possibilities of overcoming resistance. Gynecol Oncol 2017;147:695–704 - PMC - PubMed
    1. Integrated genomic analyses of ovarian carcinoma. Nature 2011;474:609–15 - PMC - PubMed
    1. Farmer H, McCabe N, Lord CJ, Tutt AN, Johnson DA, Richardson TB, et al. Targeting the DNA repair defect in BRCA mutant cells as a therapeutic strategy. Nature 2005;434:917–21 - PubMed
    1. McCabe N, Lord CJ, Tutt AN, Martin NM, Smith GC, Ashworth A. BRCA2-deficient CAPAN-1 cells are extremely sensitive to the inhibition of Poly (ADP-Ribose) polymerase: an issue of potency. Cancer Biol Ther 2005;4:934–6 - PubMed

Publication types

MeSH terms