

Coupling water fluxes with cell wall mechanics in a multicellular model of plant development
- PMID: 31220080
- PMCID: PMC6605655
- DOI: 10.1371/journal.pcbi.1007121
Coupling water fluxes with cell wall mechanics in a multicellular model of plant development
Abstract
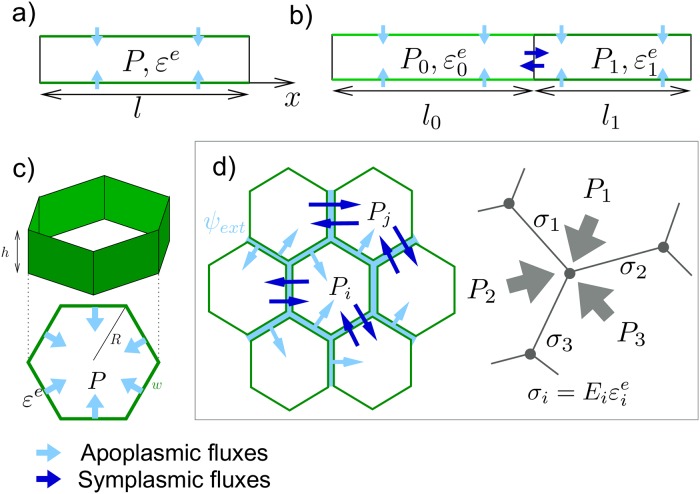
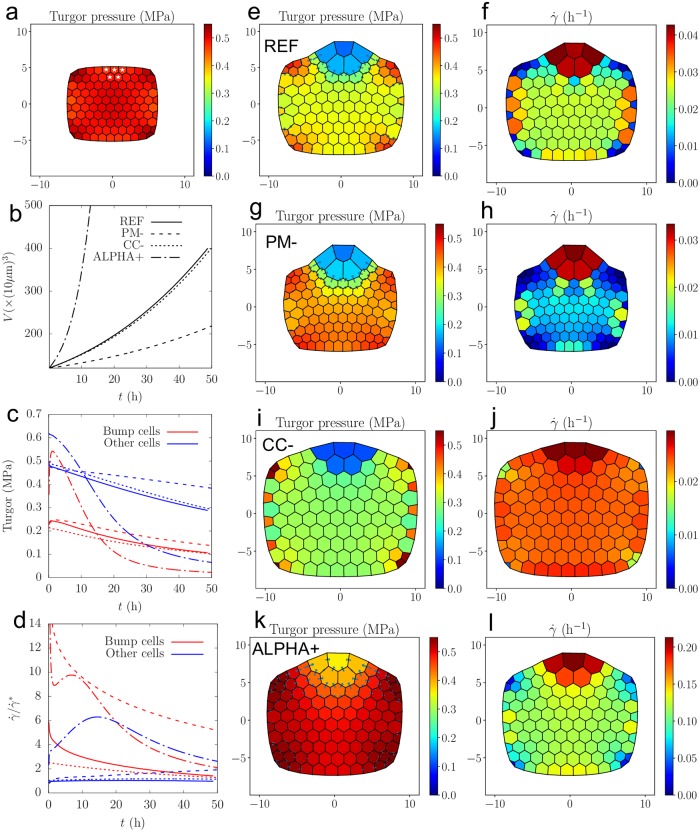
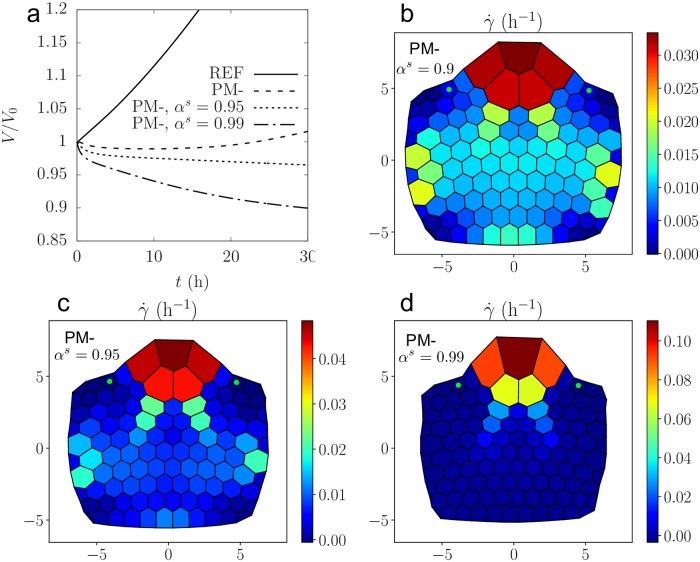
The growth of plant organs is a complex process powered by osmosis that attracts water inside the cells; this influx induces simultaneously an elastic extension of the walls and pressure in the cells, called turgor pressure; above a threshold, the walls yield and the cells grow. Based on Lockhart's seminal work, various models of plant morphogenesis have been proposed, either for single cells, or focusing on the wall mechanical properties. However, the synergistic coupling of fluxes and wall mechanics has not yet been fully addressed in a multicellular model. This work lays the foundations of such a model, by simplifying as much as possible each process and putting emphasis on the coupling itself. Its emergent properties are rich and can help to understand plant morphogenesis. In particular, we show that the model can display a new type of lateral inhibitory mechanism that amplifies growth heterogeneities due e.g to cell wall loosening.
Conflict of interest statement
The authors have declared that no competing interests exist.
Figures

Similar articles
-
Regulation of plant cell wall stiffness by mechanical stress: a mesoscale physical model.J Math Biol. 2019 Feb;78(3):625-653. doi: 10.1007/s00285-018-1286-y. Epub 2018 Sep 12. J Math Biol. 2019. PMID: 30209574
-
Simulating Turgor-Induced Stress Patterns in Multilayered Plant Tissues.Bull Math Biol. 2019 Aug;81(8):3362-3384. doi: 10.1007/s11538-019-00622-z. Epub 2019 Jun 11. Bull Math Biol. 2019. PMID: 31187342
-
Protocol for mapping the variability in cell wall mechanical bending behavior in living leaf pavement cells.Plant Physiol. 2022 Mar 4;188(3):1435-1449. doi: 10.1093/plphys/kiab588. Plant Physiol. 2022. PMID: 34908122 Free PMC article.
-
Physical models of plant development.Annu Rev Cell Dev Biol. 2014;30:59-78. doi: 10.1146/annurev-cellbio-101512-122410. Epub 2014 Jun 18. Annu Rev Cell Dev Biol. 2014. PMID: 25000996 Review.
-
Revisiting the relationship between turgor pressure and plant cell growth.New Phytol. 2023 Apr;238(1):62-69. doi: 10.1111/nph.18683. Epub 2023 Jan 13. New Phytol. 2023. PMID: 36527246 Review.
Cited by
-
Overcoming Challenges in Plant Biomechanics: Methodological Innovations and Technological Integration.Adv Sci (Weinh). 2025 Mar;12(10):e2415606. doi: 10.1002/advs.202415606. Epub 2025 Jan 31. Adv Sci (Weinh). 2025. PMID: 39887899 Free PMC article. Review.
-
Assessing the hydromechanical control of plant growth.J R Soc Interface. 2024 May;21(214):20240008. doi: 10.1098/rsif.2024.0008. Epub 2024 May 8. J R Soc Interface. 2024. PMID: 38715319 Free PMC article.
-
Modeling Plant Tissue Development Using VirtualLeaf.Methods Mol Biol. 2022;2395:165-198. doi: 10.1007/978-1-0716-1816-5_9. Methods Mol Biol. 2022. PMID: 34822154
-
Exogenous Sodium and Calcium Alleviate Drought Stress by Promoting the Succulence of Suaeda salsa.Plants (Basel). 2024 Mar 4;13(5):721. doi: 10.3390/plants13050721. Plants (Basel). 2024. PMID: 38475566 Free PMC article.
-
Expansins in Salt and Drought Stress Adaptation: From Genome-Wide Identification to Functional Characterisation in Crops.Plants (Basel). 2025 Apr 28;14(9):1327. doi: 10.3390/plants14091327. Plants (Basel). 2025. PMID: 40364355 Free PMC article. Review.
References
-
- Kutschera U. Regulation of cell expansion. The cytoskeletal basis of plant growth and form. 1991; p. 85–99.
Publication types
MeSH terms
Substances
LinkOut - more resources
Full Text Sources
