

doi: 10.1371/journal.pone.0218087.
eCollection 2019.
Optimal dispersal in ecological dynamics with Allee effect in metapopulations
Affiliations
- PMID: 31220111
- PMCID: PMC6586282
- DOI: 10.1371/journal.pone.0218087
Item in Clipboard
Optimal dispersal in ecological dynamics with Allee effect in metapopulations
PLoS One.
.
Abstract
We introduce a minimal agent-based model to understand the effects of the interplay between dispersal and geometric constraints in metapopulation dynamics under the Allee Effect. The model, which does not impose nonlinear birth and death rates, is studied both analytically and numerically. Our results indicate the existence of a survival-extinction boundary with monotonic behavior for weak spatial constraints and a nonmonotonic behavior for strong spatial constraints so that there is an optimal dispersal that maximizes the survival probability. Such optimal dispersal has empirical support from recent experiments with engineered bacteria.
Conflict of interest statement
The authors have declared that no competing interests exist.
Figures
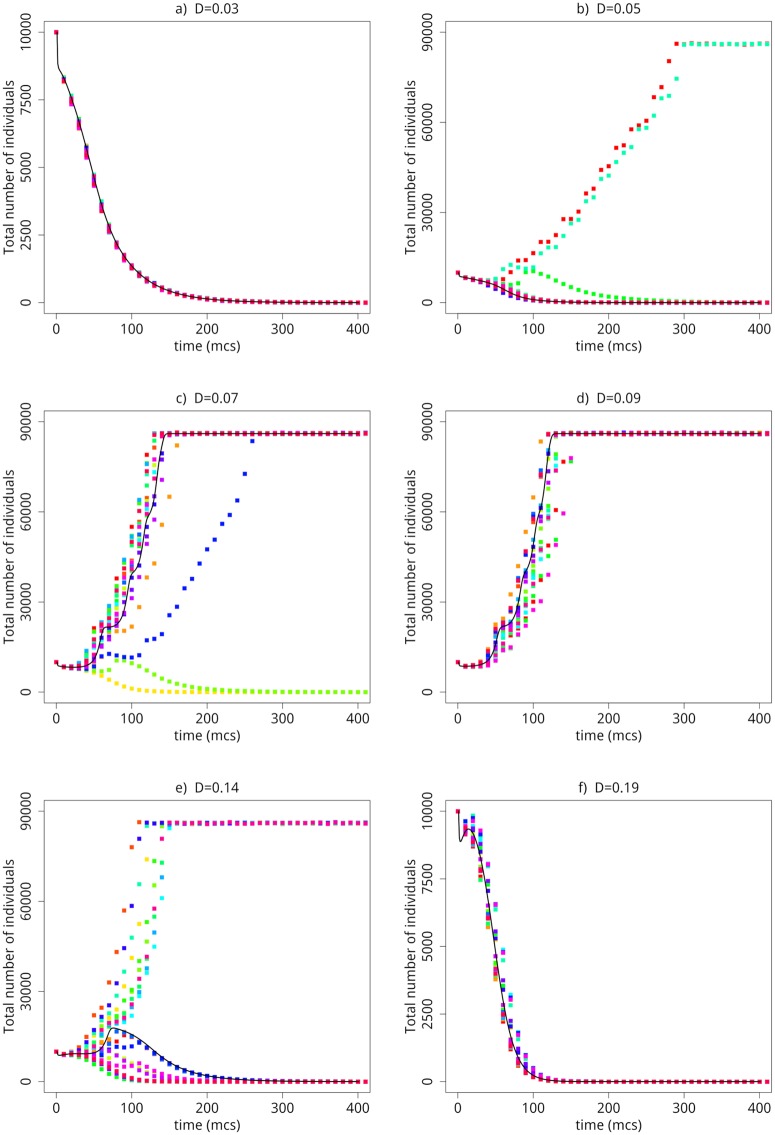
Each color corresponds to one sample. The symbols were obtained from Monte Carlo simulations and the lines from Eqs (3) and (4).
The symbols come from the Monte Carlo Simulations and the lines come from the numerical integration of Eqs (3) and (4).
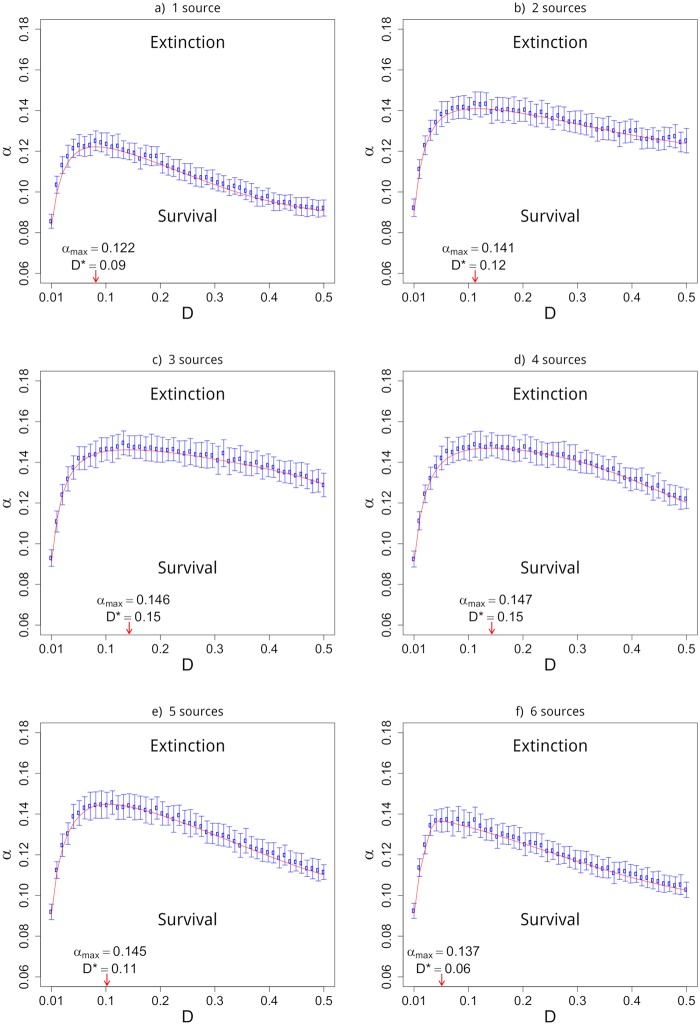
The point D = 0 is excluded from the diagram since it refers to isolated populations with threshold αc = λ/4 = 0.25. In all the cases , where n0 is the initial subpopulation size. The lines are obtained from Eqs (3) and (4). At the bottom of each plot we show the optimal dispersal D* and the corresponding maximum allowed mortality rate αmax(D*) below which the population still stay in the survival phase.
The case D = 1 is excluded because it implies no reproduction/death. The case D = 0 is excluded because it implies no migration between the patches. In all cases we keep the initial subpopulation size fixed and we use N = 104
L.
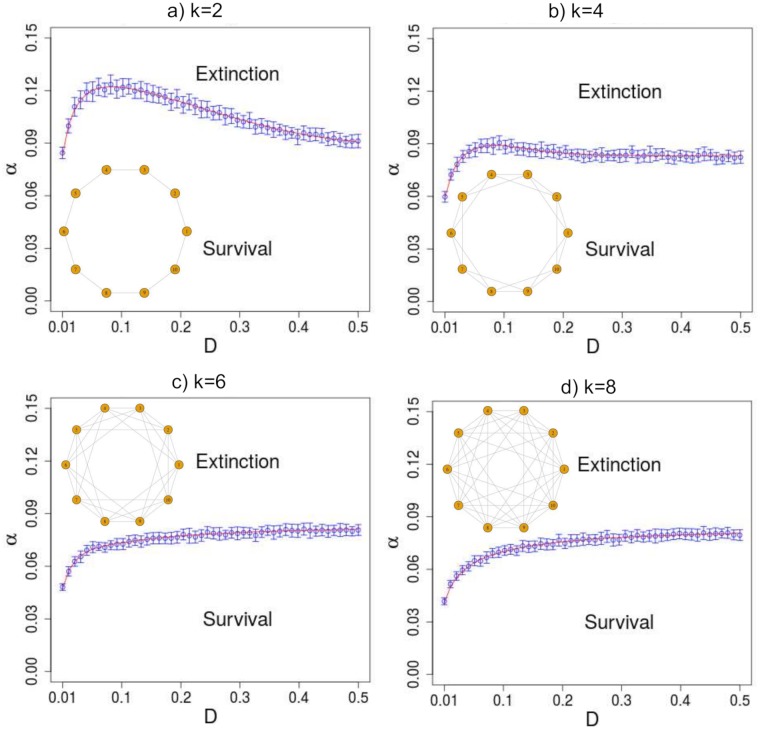
The theoretical lines (red) comes from numerical integration of Eqs (3) and (4). The optimal dispersal and the corresponding maximum α are: (a) D* = 0.09 and αmax = 0.122; (b) D* = 0.092 and αmax = 0.089.
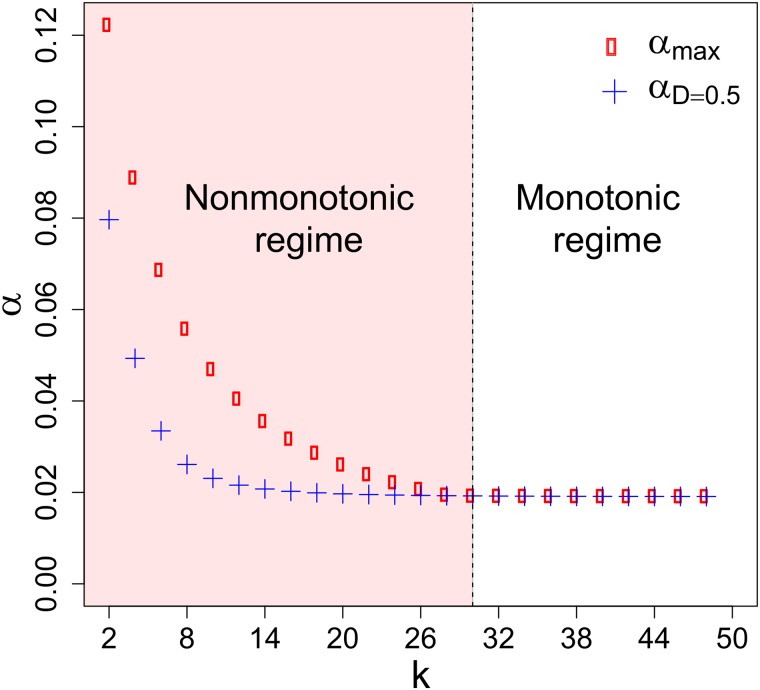
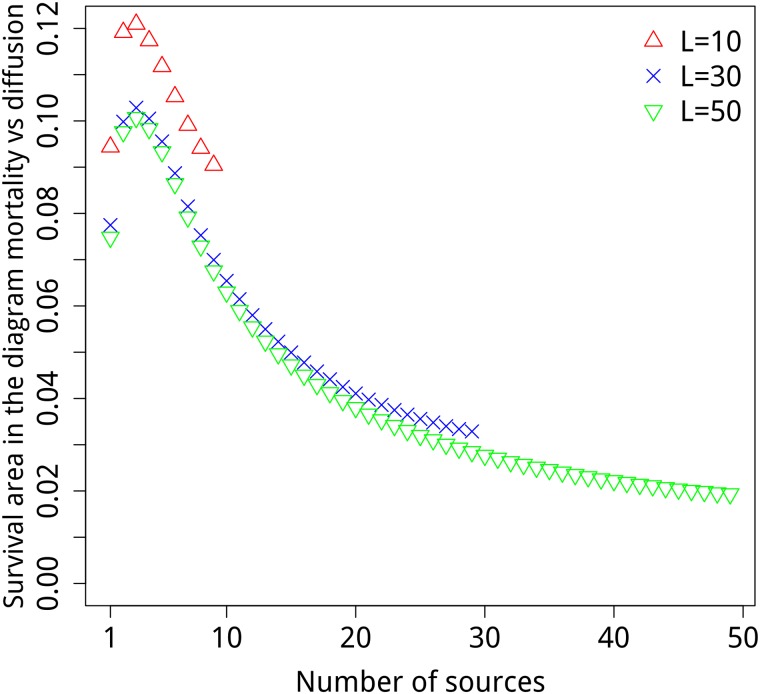
The vertical line that separates the two regimes is kthreshold = 30. For k < kthreshold: αmax > αD = 0.5 then αc × D displays a nonmonotonic dependence. For k ≥ kthreshold: αmax = αD = 0.5 then αc × D exhibits a monotonic dependence.
Similar articles
-
Optimal dispersal and diffusion-enhanced robustness in two-patch metapopulations: origin's saddle-source nature matters.Theory Biosci. 2024 Feb;143(1):79-95. doi: 10.1007/s12064-023-00411-2. Epub 2024 Feb 21. Theory Biosci. 2024. PMID: 38383684 Free PMC article.
-
Allee-like effects in metapopulation dynamics.Math Biosci. 2004 May;189(1):103-13. doi: 10.1016/j.mbs.2003.06.001. Math Biosci. 2004. PMID: 15051417
-
Evolutionary suicide and evolution of dispersal in structured metapopulations.J Math Biol. 2002 Aug;45(2):79-105. doi: 10.1007/s002850200151. J Math Biol. 2002. PMID: 12181600
-
Carrying Capacity of Spatially Distributed Metapopulations.Trends Ecol Evol. 2021 Feb;36(2):164-173. doi: 10.1016/j.tree.2020.10.007. Epub 2020 Oct 28. Trends Ecol Evol. 2021. PMID: 33129588 Review.
-
Novel insights on population and range edge dynamics using an unparalleled spatiotemporal record of species invasion.J Anim Ecol. 2018 May;87(3):581-593. doi: 10.1111/1365-2656.12755. Epub 2017 Oct 17. J Anim Ecol. 2018. PMID: 28892141 Review.
Cited by
-
Simulating the dynamics of dispersal and dispersal ability in fragmented populations with mate-finding Allee effects.Ecol Evol. 2023 Apr 21;13(4):e10021. doi: 10.1002/ece3.10021. eCollection 2023 Apr. Ecol Evol. 2023. PMID: 37091574 Free PMC article.
-
How Important Is Informed Natal Dispersal for Modelling the Demographic and Genetic Effects of Environmental Variability?Ecol Evol. 2024 Dec 16;14(12):e70681. doi: 10.1002/ece3.70681. eCollection 2024 Dec. Ecol Evol. 2024. PMID: 39691436 Free PMC article.
References
-
- Allee W. C. Animal aggregations, a study in general sociology. Univ. of Chicago Press, Chicago: 1931.
-
- Stephens PA, Sutherland WJ, Freckleton RP. What is the Allee effect?. Oikos. 1999. October 1:185–90. 10.2307/3547011 - DOI
-
- Drake JM and Kramer AM. Allee effects. Nat. Educ. Knowl 310 (2011): 2.
-
- Courchamp F, Berec L, Gascoigne J. Allee effects in ecology and conservation. Oxford University Press; 2008. February 14.
-
- Kramer AM, Dennis B, Liebhold AM, Drake JM. The evidence for Allee effects. Population Ecology. 2009. July 1;51(3):341 10.1007/s10144-009-0152-6 - DOI
Publication types
MeSH terms
LinkOut - more resources
Full Text Sources
