. 2019 Jun 20;15(6):e1007833.
doi: 10.1371/journal.ppat.1007833. eCollection 2019 Jun.

Neutrophil and macrophage influx into the central nervous system are inflammatory components of lethal Rift Valley fever encephalitis in rats

Affiliations

Neutrophil and macrophage influx into the central nervous system are inflammatory components of lethal Rift Valley fever encephalitis in rats

Joseph R Albe et al. PLoS Pathog. .

Abstract

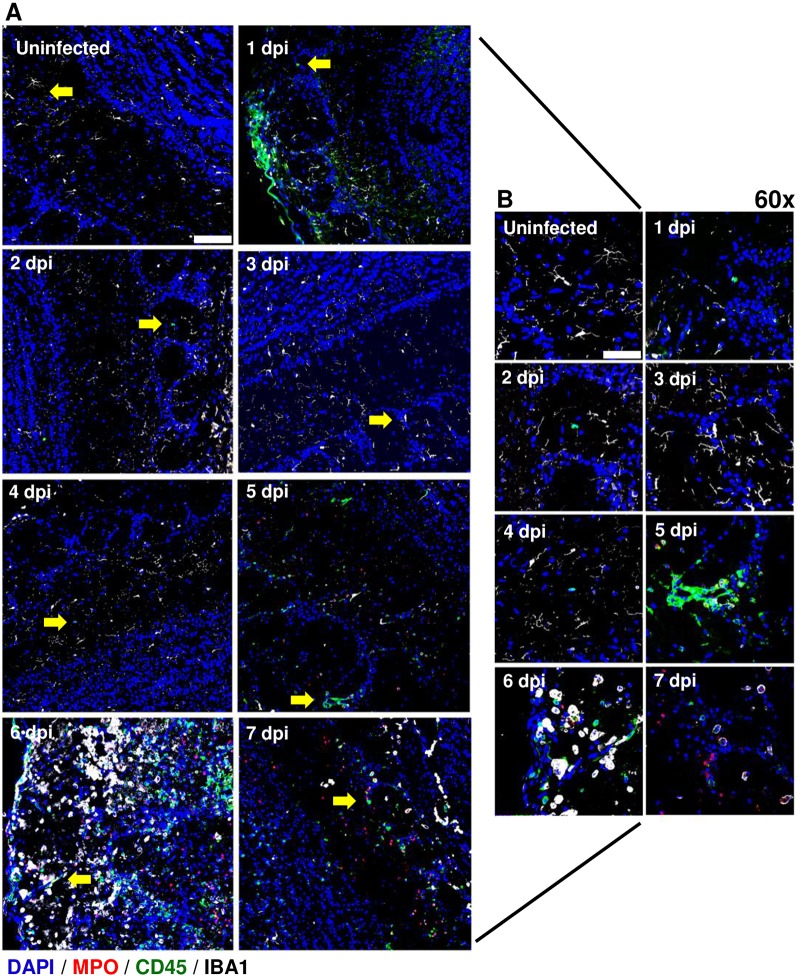
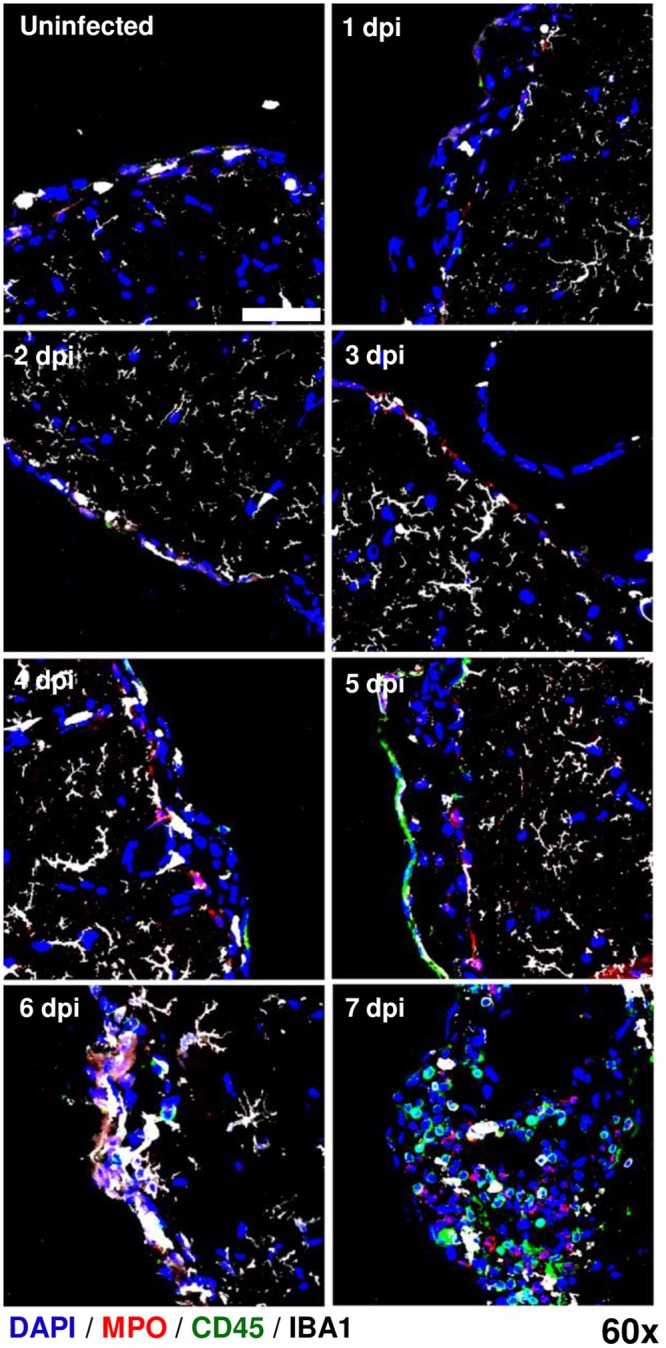
Rift Valley fever virus (RVFV) causes severe disease in livestock concurrent with zoonotic transmission to humans. A subset of people infected with RVFV develop encephalitis, and significant gaps remain in our knowledge of how RVFV causes pathology in the brain. We previously found that, in Lewis rats, subcutaneous inoculation with RVFV resulted in subclinical disease while inhalation of RVFV in a small particle aerosol caused fatal encephalitis. Here, we compared the disease course of RVFV in Lewis rats after each different route of inoculation in order to understand more about pathogenic mechanisms of fatal RVFV encephalitis. In aerosol-infected rats with lethal encephalitis, neutrophils and macrophages were the major cell types infiltrating the CNS, and this was concomitant with microglia activation and extensive cytokine inflammation. Despite this, prevention of neutrophil infiltration into the brain did not ameliorate disease. Unexpectedly, in subcutaneously-inoculated rats with subclinical disease, detectable viral RNA was found in the brain along with T-cell infiltration. This study sheds new light on the pathogenic mechanisms of RVFV encephalitis.


Conflict of interest statement

The authors have declared that no competing interests exist.

Figures

Fig 1
Fig 1. Rat survival and spread of RVFV throughout tissues after SC or AERO infection.
Rats were challenged with RVFV ZH501 via AERO or SC. (A) Comparison of survival at the indicated exposure doses (n = 6–12 rats per dose group). (B-E) vRNA (measured by q-RT-PCR and expressed as pfu/g equivalents) was measured in each indicated tissue (n = 3–7 rats/group). (B) CNS tissues from AERO-infected rats (C) peripheral tissues from AERO-infected rats. (D) CNS tissues from SC-infected rats (E) peripheral tissues from SC-infected rats. Dotted line represents limit of detection of the q-RT-PCR assay. Shaded grey box (5–7 dpi) represents clinical window during which AERO-infected Lewis rats display signs of illness.
Fig 2
Fig 2. Granulocytosis is a feature of end-stage RVF disease after AERO-infection.
18-parameter complete blood count (CBC) and multicolor flow cytometry were performed on whole blood at each time point. (A) Total white blood cells (WBC) and (B) platelets (PLT). (C-E) Paired graphs show a comparison between data obtained from CBC (top) and flow cytometry (bottom). (C-E) Total # of each indicated cell type. Data from rats infected SC with 1x10⁵ pfu/rat and euthanized at 10 dpi is included for comparison. Shaded grey box represents clinical window of AERO-infected rats. N = 3–6 rats/timepoint. LYM = lymphocytes; GRAN = granulocytes; MON = monocytes. Gating strategy shown in S3 Fig. Asterisks above symbols indicate significance of individual time points compared to uninfected (N.S., not significant; *, P < 0.05; **, P < 0.01; ***, P < 0.001; ****, P < 0.0001). Asterisk above a bar indicates significance over the encompassed data points.
Fig 3
Fig 3. Leukocyte infiltration into the brains of RVFV-infected rats.
Characterization of cell infiltrates into rat brains was done by flow cytometry. (A) Representative examples of CD45 expression on live cells obtained from uninfected (left), SC-infected (middle), and AERO-infected (right) rats as characterized by flow cytometry. (B) Total cell counts obtained by counting live cells on a hemocytometer after ficoll-gradient isolation. (C) CD45hi cells, which represent either infiltrating leukocytes or activated microglia, (D) CD45med cells represent resting microglia (E) Neutrophils (Neut) as identified by RP-1+, CD11b+, CD45+, (F) Macrophages (Mac) as identified by CD163+, CD11b+, CD45+, (G) CD3+, (H) CD8+, and (I) CD4+ cells. N = 3–7 rats/timepoint. Day 0 time point represents mock-infected rats. The # in the bottom right corner indicates significance by 2-way ANOVA (#, P < 0.05; ##, P < 0.01; ###, P < 0.001; ####, P < 0.0001); asterisks above symbols indicate significance of individual time points compared to uninfected (*, P < 0.05; **, P < 0.01; ***, P < 0.001; ****, P < 0.0001). Asterisk above a bar indicates significance over the encompassed data points.
Fig 4
Fig 4. Early serum cytokine responses occur in SC-infected rats compared to a late cytokine/chemokine storm in the brain of AERO-infected rats.
Cytokines were assessed by a 22-plex Luminex kit. (A) Select serum cytokines. (B) Select cytokines in homogenized brain tissue. CTL represents mock-infected rats. For statistical analysis, 2-way ANOVA with multiple comparisons was performed (see Methods section). The # in the bottom right corner indicates significance by 2-way ANOVA (N.S., not significant; #, P < 0.05; ##, P < 0.01; ###, P < 0.001; ####, P < 0.0001); asterisks above symbols indicate significance of individual time points compared to uninfected (*, P < 0.05; **, P < 0.01; ***, P < 0.001; ****, P < 0.0001). Asterisk above a bar indicates significance over the encompassed data points.
Fig 5
Fig 5. Replication of RVFV in CNS cell lines and detection of infected cells by flow cytometry.
(A) vRNA production (left) and infectious virus (right) produced from the indicated cell lines after infection at MOI = 1. One-way ANOVA was used to determine statistical significance between the cell lines at each time point. Significance indicated by asterisks. RVFV antigen was detected in (B) undifferentiated SH-SY5Y cells (C) HMC3, and (D) HAPI cells using intracellular flow cytometry. Uninfected cells (gray) were stained at the same time as the infected cells (red). Numbers indicated MFI of RVFV antigen staining.
Fig 6
Fig 6. Detection of RVFV-infected cells within rat brains.
Representative flow cytometry plots of brain cells isolated from AERO-infected rats. Live cells were first gated on Iba-1 then assessed for CD45 expression. (A) All Iba-1+ cells showing differential expression of CD45. Viral antigen within (B) CD45med, (C) CD45hi, and (D) neutrophils. Cells isolated from uninfected rat brains (gray) are compared to infected rat brains (red) at the indicated time points. The corresponding MFI of viral antigen staining is indicated by the number within the histogram. (E) Comparison of MFI of RVFV Ag staining within the indicated cell populations (n = 2–4 samples/time point). Statistical significance determined by 2-way ANOVA with multiple comparisons. MFI from all 7 dpi samples were statistically significant compared to 0,1,4 dpi.
Fig 7
Fig 7. Visualization of RVFV infection in the olfactory bulb.
AERO-infected Lewis rat olfactory bulbs show evidence of increased viral RNA within the glomerular layer from 1 dpi to 7 dpi. RVFV RNA was detected by in situ hybridization immunofluorescence (ISH-IF) (red). Samples were co-stained with an antibody for microglia (IBA-1; white), a Nissl body dye (Neurotrace; green), and nuclear counterstain (DAPI; blue). (A) Uninfected 40x micrograph labeled: GL; glomerular layer, EPL; external plexiform layer, MCL; mitral cell layer, GCL; granule cell layer. 2x2 field large images at 40x magnification were stitched using Nikon Elements software (scale bar = 100um). Yellow arrows indicate areas of viral RNA detection within the glomerular layer that is magnified in (B). (B) Max intensity projection images of the glomerular layer taken at 60x (scale bar = 50um).
Fig 8
Fig 8. Visualization of RVFV infection in the cortex.
AERO-infected Lewis rat brain prefrontal cortexes show evidence of increased RVFV viral RNA over the time course of infection from 1 dpi to 7 dpi. RVFV RNA was detected by ISH-IF (red). Samples were co-stained with an antibody for microglia (IBA-1; white), a Nissl body dye (Neurotrace; green), and nuclear counterstain (DAPI; blue). Yellow arrowheads highlight areas of extracellular virus; yellow pointers highlight infected neurons. Single field 60x magnification images taken with a Nikon A1 confocal microscope (scale bar = 50um).
Fig 9
Fig 9. Visualization of leukocyte infiltration into the olfactory bulb of AERO infected rats.
AERO-infected Lewis rat olfactory bulbs show evidence of increased cell infiltration from 1 dpi to 7 dpi. Samples were stained with primary antibodies to detect neutrophils (MPO; red), a pan-leukocyte marker (CD45; green), and microglia (IBA-1; white) along with nuclear counterstain (DAPI; blue). (A) 2x2 field images were taken with at 40x magnification and stitched using Nikon Elements software (scale bar = 100um). Yellow arrows indicate areas magnified in (B). (B) Max intensity projection images of the olfactory bulb taken at 60 (scale bar = 50um).
Fig 10
Fig 10. Leukocyte infiltration into the cortex after RVFV AERO infection.
RVFV-infected Lewis rat cortexes show evidence of increased cell infiltration from 1 dpi to 7 dpi. Samples were stained with primary antibodies to detect neutrophils (MPO; red), general leukocytes (CD45; green), and microglia (IBA-1; white) along with nuclear counterstain (DAPI; blue). Max intensity projection images of the cortex blood brain barrier taken at 60x (scale bar = 50um).
Fig 11
Fig 11. Prevention of neutrophil migration into the brain using a CXCR2 antagonist.
RVFV-infected rats were treated with SB-265610 on 0 dpi, 3 dpi, or a vehicle control. (A) Survival curve. Neither 3 dpi nor 0 dpi were significantly different from vehicle control rats using Log-rank Mantel-Cox test. (B) Number of neutrophils in rat brains at time of necropsy as measured by flow cytometry (n = 3 rats/tx group; n = 2 for no tx group). One-way ANOVA with multiple comparisons was used to determine statistical significance. Representative flow plots of neutrophils (RP-1+, CD11b+, CD45+) for (C) no treatment (no Tx) (D) 0 dpi, and (E) 3 dpi treatment groups. Color gradient in B-D indicates RVFV antigen expression, with red indicating the brightest expression and blue the lowest.

Similar articles

Cited by

References

    1. World Health Organization. Rift Valley fever–Kenya 2018 [6/18/18]. https://www.who.int/csr/don/18-june-2018-rift-valley-fever-kenya/en/.
    1. World Health Organization. Rift Valley fever–Gambia 2018 [cited 2018 3/16/18]. http://www.who.int/csr/don/26-february-2018-rift-valley-fever-gambia/en/.
    1. World Health Organization. South Sudan declares Rift Valley fever outbreak in parts of Eastern Lakes State 2018 [updated March 12, 2018; cited 2018 3/16/18]. http://www.afro.who.int/news/south-sudan-declares-rift-valley-fever-outb....
    1. World Health Organization. Annual review of diseases prioritized under the Research and Development Blueprint. 2017 January 24–25, 2017. Report No.
    1. LaBeaud AD, Pfeil S, Muiruri S, Dahir S, Sutherland LJ, Traylor Z, et al. Factors associated with severe human Rift Valley fever in Sangailu, Garissa County, Kenya. PLoS neglected tropical diseases. 2015;9(3):e0003548 Epub 2015/03/13. 10.1371/journal.pntd.0003548 - DOI - PMC - PubMed

Publication types

MeSH terms