

Assessment of reproducibility and biological variability of fasting and postprandial plasma metabolite concentrations using 1H NMR spectroscopy
- PMID: 31220183
- PMCID: PMC6586348
- DOI: 10.1371/journal.pone.0218549
Assessment of reproducibility and biological variability of fasting and postprandial plasma metabolite concentrations using 1H NMR spectroscopy
Abstract
Introduction: It is crucial to understand the factors that introduce variability before applying metabolomics to clinical and biomarker research.
Objectives: We quantified technical and biological variability of both fasting and postprandial metabolite concentrations measured using 1H NMR spectroscopy in plasma samples.
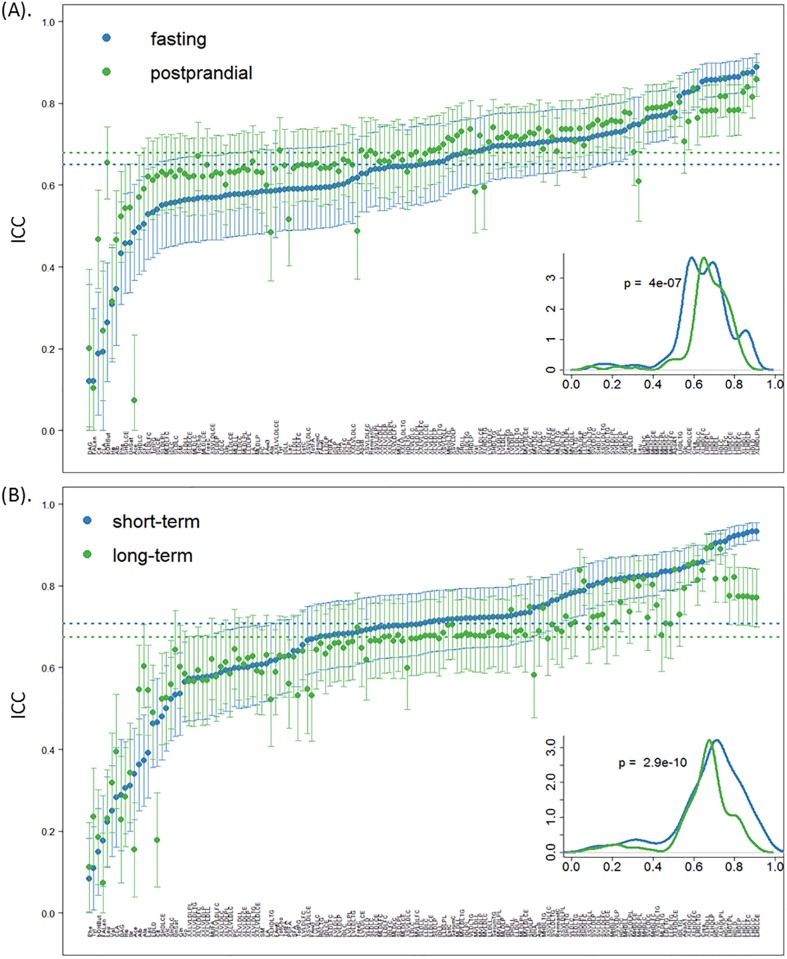
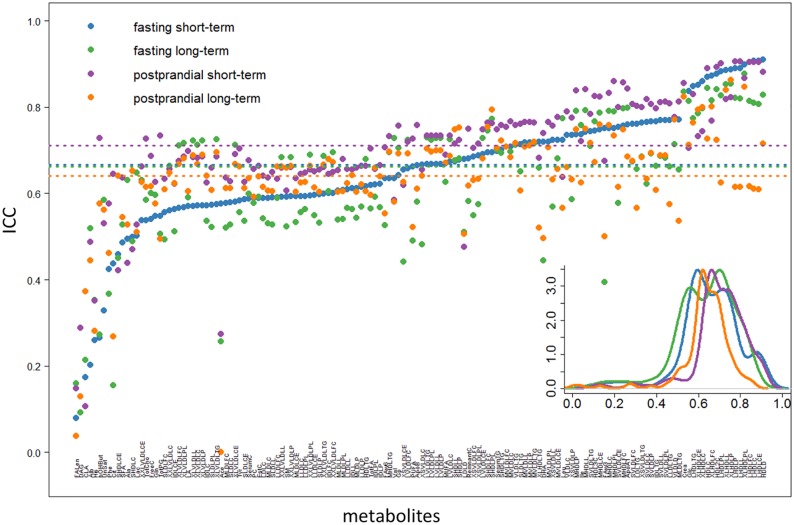
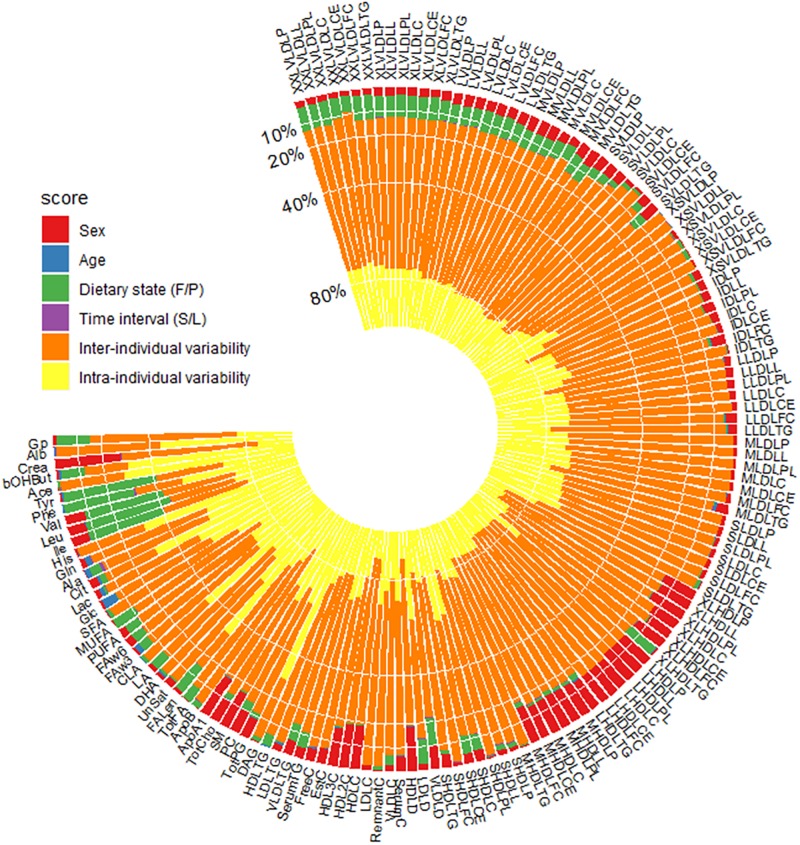
Methods: In the Netherlands Epidemiology of Obesity study (n = 6,671), 148 metabolite concentrations (101 metabolites belonging to lipoprotein subclasses) were measured under fasting and postprandial states (150 minutes after a mixed liquid meal). Technical variability was evaluated among 265 fasting and 851 postprandial samples, with the identical blood plasma sample being measured twice by the same laboratory protocol. Biological reproducibility was assessed by measuring 165 individuals twice across time for evaluation of short- (<6 months) and long-term (>3 years) biological variability. Intra-class coefficients (ICCs) were used to assess variability. The ICCs of the fasting metabolites were compared with the postprandial metabolites using two-sided paired Wilcoxon test separately for short- and long-term measurements.
Results: Both fasting and postprandial metabolite concentrations showed high technical reproducibility using 1H NMR spectroscopy (median ICC = 0.99). Postprandial metabolite concentrations revealed slightly higher ICC scores than fasting ones in short-term repeat measures (median ICC in postprandial and fasting metabolite concentrations 0.72 versus 0.67, Wilcoxon p-value = 8.0×10⁻¹⁴). Variability did not increase further in a long-term repeat measure, with median ICC in postprandial of 0.64 and in fasting metabolite concentrations 0.66.
Conclusion: Technical reproducibility is excellent. Biological reproducibility of postprandial metabolite concentrations showed a less or equal variability than fasting metabolite concentrations over time.
Conflict of interest statement
I have read the journal’s policy and the authors of this manuscript have the following competing interests: Dennis Mook-Kanamori is a part-time clinical research consultant for Metabolon, Inc. This does not alter our adherence to PLOS ONE policies on sharing data and materials. All other authors have nothing to disclose.
Figures

Similar articles
-
Characterisation of Fasting and Postprandial NMR Metabolites: Insights from the ZOE PREDICT 1 Study.Nutrients. 2023 Jun 5;15(11):2638. doi: 10.3390/nu15112638. Nutrients. 2023. PMID: 37299601 Free PMC article.
-
Translational Metabolomics of Head Injury: Exploring Dysfunctional Cerebral Metabolism with Ex Vivo NMR Spectroscopy-Based Metabolite Quantification.In: Kobeissy FH, editor. Brain Neurotrauma: Molecular, Neuropsychological, and Rehabilitation Aspects. Boca Raton (FL): CRC Press/Taylor & Francis; 2015. Chapter 25. In: Kobeissy FH, editor. Brain Neurotrauma: Molecular, Neuropsychological, and Rehabilitation Aspects. Boca Raton (FL): CRC Press/Taylor & Francis; 2015. Chapter 25. PMID: 26269925 Free Books & Documents. Review.
-
Postprandial metabolomics: A pilot mass spectrometry and NMR study of the human plasma metabolome in response to a challenge meal.Anal Chim Acta. 2016 Feb 18;908:121-31. doi: 10.1016/j.aca.2015.12.009. Epub 2015 Dec 17. Anal Chim Acta. 2016. PMID: 26826694
-
Characterizing human postprandial metabolic response using multiway data analysis.Metabolomics. 2024 May 9;20(3):50. doi: 10.1007/s11306-024-02109-y. Metabolomics. 2024. PMID: 38722393 Free PMC article.
-
Folic acid supplementation and malaria susceptibility and severity among people taking antifolate antimalarial drugs in endemic areas.Cochrane Database Syst Rev. 2022 Feb 1;2(2022):CD014217. doi: 10.1002/14651858.CD014217. Cochrane Database Syst Rev. 2022. PMID: 36321557 Free PMC article.
Cited by
-
Nuclear magnetic resonance-based metabolomics with machine learning for predicting progression from prediabetes to diabetes.Elife. 2024 Sep 20;13:RP98709. doi: 10.7554/eLife.98709. Elife. 2024. PMID: 39302270 Free PMC article.
-
Commentary: Metabolomics-Based Studies Assessing Exercise-Induced Alterations of the Human Metabolome: A Systematic Review.Front Physiol. 2020 Apr 22;11:353. doi: 10.3389/fphys.2020.00353. eCollection 2020. Front Physiol. 2020. PMID: 32390864 Free PMC article. No abstract available.
-
Associations of childhood BMI, general and visceral fat mass with metabolite profiles at school-age.Int J Obes (Lond). 2024 Sep;48(9):1307-1317. doi: 10.1038/s41366-024-01558-8. Epub 2024 Jun 8. Int J Obes (Lond). 2024. PMID: 38851839
-
Novel type 2 diabetes prediction score based on traditional risk factors and circulating metabolites: model derivation and validation in two large cohort studies.EClinicalMedicine. 2024 Dec 6;79:102971. doi: 10.1016/j.eclinm.2024.102971. eCollection 2025 Jan. EClinicalMedicine. 2024. PMID: 39720612 Free PMC article.
-
Predictive value of circulating NMR metabolic biomarkers for type 2 diabetes risk in the UK Biobank study.BMC Med. 2022 May 3;20(1):159. doi: 10.1186/s12916-022-02354-9. BMC Med. 2022. PMID: 35501852 Free PMC article.
References
Publication types
MeSH terms
Substances
Grants and funding
LinkOut - more resources
Full Text Sources
