. 2019 Jun 20;15(6):e1007812.
doi: 10.1371/journal.ppat.1007812. eCollection 2019 Jun.

Killing from the inside: Intracellular role of T3SS in the fate of Pseudomonas aeruginosa within macrophages revealed by mgtC and oprF mutants

Affiliations

Killing from the inside: Intracellular role of T3SS in the fate of Pseudomonas aeruginosa within macrophages revealed by mgtC and oprF mutants

Preeti Garai et al. PLoS Pathog. .

Abstract

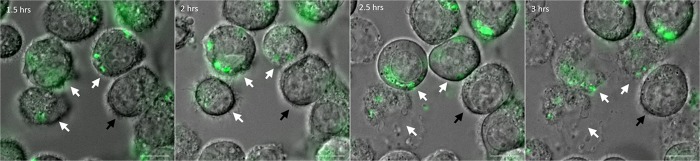
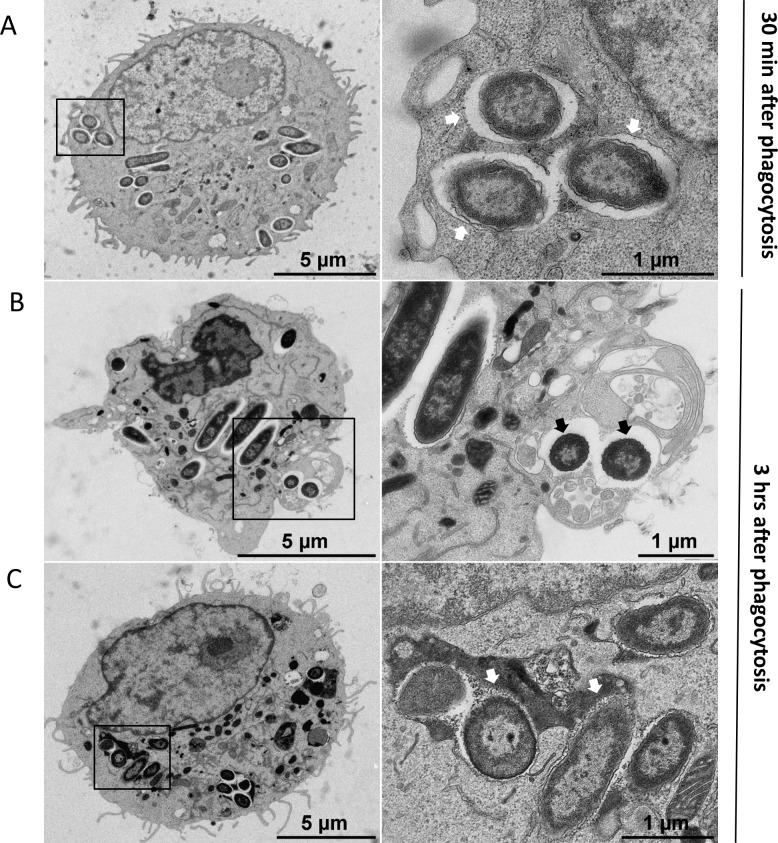
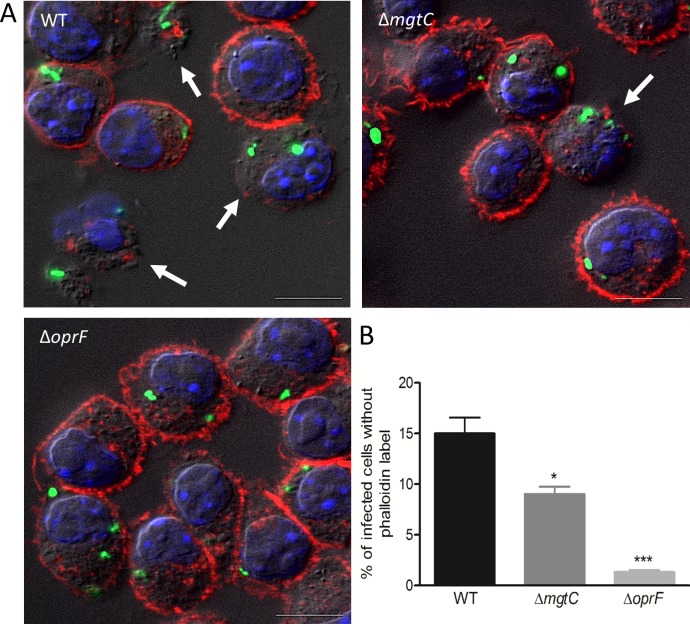
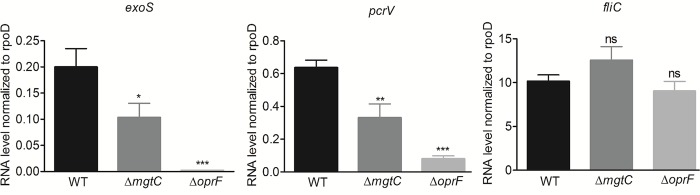
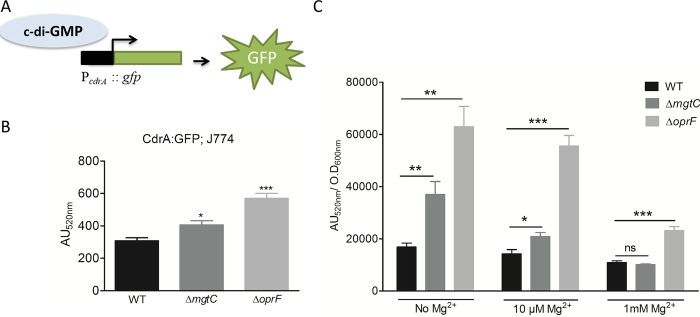
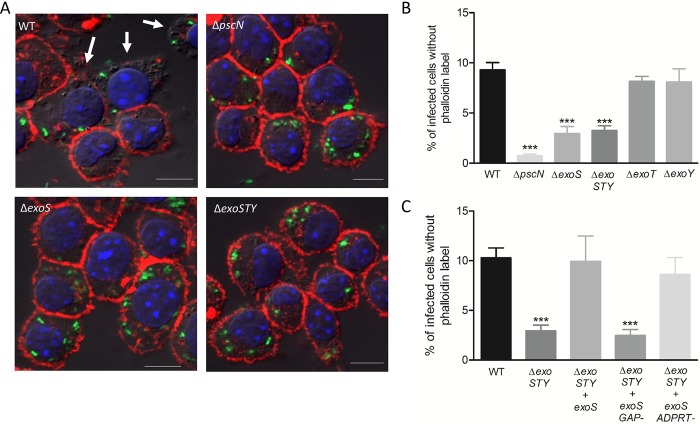
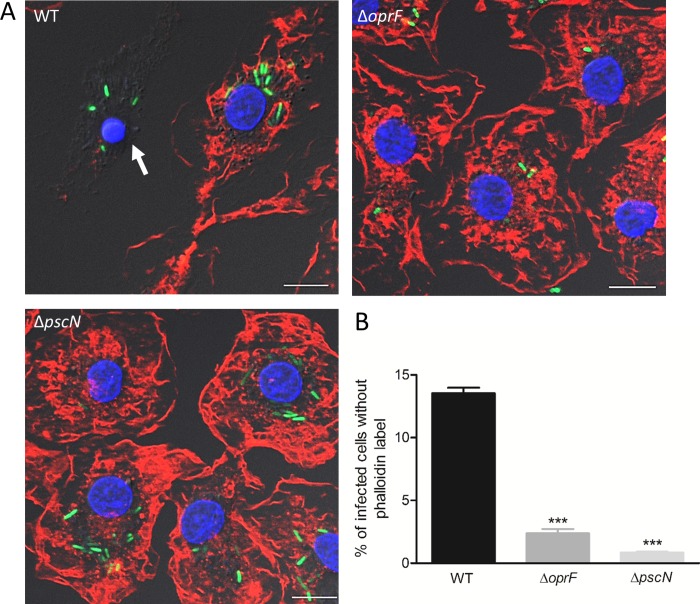
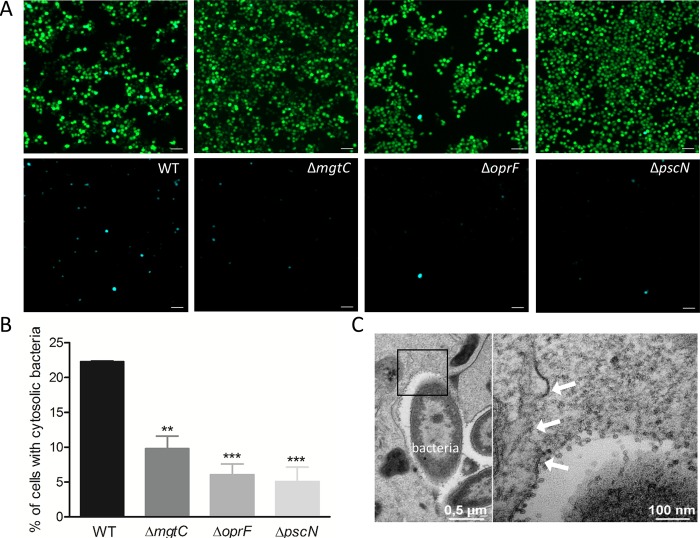
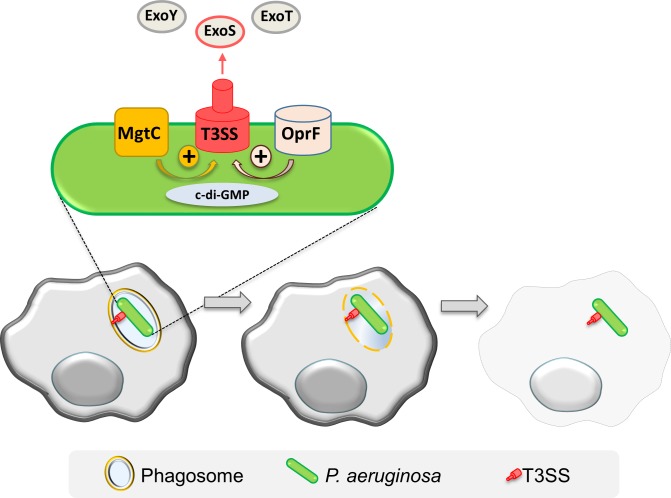
While considered solely an extracellular pathogen, increasing evidence indicates that Pseudomonas aeruginosa encounters intracellular environment in diverse mammalian cell types, including macrophages. In the present study, we have deciphered the intramacrophage fate of wild-type P. aeruginosa PAO1 strain by live and electron microscopy. P. aeruginosa first resided in phagosomal vacuoles and subsequently could be detected in the cytoplasm, indicating phagosomal escape of the pathogen, a finding also supported by vacuolar rupture assay. The intracellular bacteria could eventually induce cell lysis, both in a macrophage cell line and primary human macrophages. Two bacterial factors, MgtC and OprF, recently identified to be important for survival of P. aeruginosa in macrophages, were found to be involved in bacterial escape from the phagosome as well as in cell lysis caused by intracellular bacteria. Strikingly, type III secretion system (T3SS) genes of P. aeruginosa were down-regulated within macrophages in both mgtC and oprF mutants. Concordantly, cyclic di-GMP (c-di-GMP) level was increased in both mutants, providing a clue for negative regulation of T3SS inside macrophages. Consistent with the phenotypes and gene expression pattern of mgtC and oprF mutants, a T3SS mutant (ΔpscN) exhibited defect in phagosomal escape and macrophage lysis driven by internalized bacteria. Importantly, these effects appeared to be largely dependent on the ExoS effector, in contrast with the known T3SS-dependent, but ExoS independent, cytotoxicity caused by extracellular P. aeruginosa towards macrophages. Moreover, this macrophage damage caused by intracellular P. aeruginosa was found to be dependent on GTPase Activating Protein (GAP) domain of ExoS. Hence, our work highlights T3SS and ExoS, whose expression is modulated by MgtC and OprF, as key players in the intramacrophage life of P. aeruginosa which allow internalized bacteria to lyse macrophages.


Conflict of interest statement

The authors have declared that no competing interests exist.

Figures

Fig 1
Fig 1. Live imaging of macrophages infected with P. aeruginosa.
J774 macrophages were infected with PAO1 wild-type (WT) strain expressing GFP. Time lapse imaging was started at 1.5 hrs post-phagocytosis. Cells were maintained in DMEM supplemented with gentamicin at 37°C and 5% CO2 throughout imaging. White arrows point at the cells that harbor intracellular bacteria and undergo lysis between 1.5 hrs and 3 hrs post-phagocytosis. Black arrow shows an uninfected and unlysed cell. Scale bar is equivalent to 10 μm.
Fig 2
Fig 2. Transmission electron micrographs (TEM) of P. aeruginosa within macrophages.
J774 macrophages were infected with P. aeruginosa for 30 min (A) or 3 hrs (B and C) and subjected to TEM (left panels). Black rectangles show intracellular bacteria that are shown at higher magnification in the right panels. A. At early time after phagocytosis, most of bacteria were found inside membrane bound vacuoles (white arrows). B. At later time, some bacteria can be observed in the cytoplasm with no surrounding membrane suggesting disruption of the vacuole membrane (black arrows). The infected macrophage in panel B shows an abnormal morphology, with highly condensed chromatin and membrane blebbing, but no pseudopodia. C. At later time, bacteria can also be found in vacuole partially or totally filled with heterogeneous electron dense material (white arrows), suggesting that the vacuole has fused with lysosomes. The infected macrophage shown in panel C appears normal.
Fig 3
Fig 3
Visualization (A) and quantification (B) of lysed infected cells upon phalloidin labeling. GFP expressing PAO1 WT, ΔmgtC and ΔoprF strains were used for infecting J774 macrophages. Gentamicin was added after phagocytosis and cells were fixed at 2 hrs post-phagocytosis, stained with phalloidin and imaged with fluorescent microscope. DAPI was used to stain the nucleus. Cells that have intracellular bacteria, but lack the phalloidin cortical label were considered as lysed by intracellular bacteria (shown by arrows). Scale bar is equivalent to 10 μm. After imaging, infected cells were counted and percentage of lysed cells with intracellular bacteria out of total number of cells was plotted for each strain. Error bars correspond to standard errors from three independent experiments. At least 200 cells were counted per strain. The asterisks indicate P values (One way ANOVA, where all strains were compared to WT using Dunnett’s multiple comparison post-test, *P <0.05 and ***P <0.001), showing statistical significance with respect to WT.
Fig 4
Fig 4. Expression of T3SS genes in P. aeruginosa strains residing in J774 macrophages.
J774 macrophages were infected with PAO1 WT, ΔmgtC and ΔoprF strains. After phagocytosis, cells were maintained in DMEM supplemented with gentamicin. RNA was extracted from bacteria isolated from infected macrophages 1 hr after phagocytosis. The level of exoS, pcrV and fliC transcripts relative to those of the house-keeping gene rpoD was measured by qRT-PCR and plotted on the Y-axis. Error bars correspond to standard errors from at least three independent experiments. The asterisks indicate P values (One way ANOVA, where all strains were compared to WT using Dunnett’s multiple comparison post-test, *P <0.05, **P <0.01, ***P <0.001 and ns = P >0.05 or non-significant), showing statistical significance with respect to WT.
Fig 5
Fig 5. Measurement of c-di-GMP level in ΔmgtC and ΔoprF mutants.
PAO1 WT, ΔmgtC and ΔoprF harboring reporter plasmid pCdrA::gfp, which expresses GFP under the control of the promoter of c-di-GMP responsive gene cdrA (A), were used to infect J774 cells and fluorescence was measured (B). After phagocytosis, DMEM containing 300 μg/ml of amikacin was added to eliminate extracellular bacteria. Fluorescence (excitation, 485 nm and emission, 520 nm) was measured 1 hour after phagocytosis and plotted as arbitrary units (AU). Error bars correspond to standard errors from four independent experiments. The asterisks indicate P values (One way ANOVA, where all strains were compared to WT using Dunnett’s multiple comparison post-test, *P <0.05 and ***P <0.001), showing statistical significance with respect to WT. (C) PAO1 WT, ΔmgtC and ΔoprF harboring reporter plasmid pCdrA::gfp, were grown in NCE medium with varying concentration of Mg2+. After 1 hour of growth, fluorescence (excitation, 485 nm and emission, 520 nm) of the culture was measured along with its OD600nm. The fluorescence was plotted as arbitrary units (AU520nm) after normalizing with OD600nm. Error bars correspond to standard errors from three independent experiments. The asterisks indicate P values showing statistical significance with respect to WT in the respective condition, using Student’s t test (ns = P >0.05,*P <0.05, **P <0.01 and ***P <0.001).
Fig 6
Fig 6. Assessment of role of T3SS and its effectors in cell lysis induced by intracellular PAO1.
J774 macrophages were infected with GFP expressing strains as indicated. After phagocytosis, cells were maintained in DMEM supplemented with gentamicin. Cells were imaged 2 hrs post-phagocytosis after staining with phalloidin (A). Scale bar is equivalent to 10 μm. Lysis was quantified (B & C) by counting infected cells lacking cortical labeling (indicated by arrows). Percentage of lysed cells with intracellular bacteria out of total number of infected cells was plotted. Error bars correspond to standard errors from at least three independent experiments. At least 200 cells were counted per strain. The asterisks indicate P values (One way ANOVA, where all strains were compared to WT using Dunnett’s multiple comparison test, ***P <0.001), showing statistical significance with respect to WT.
Fig 7
Fig 7. Visualization and quantification of lysis of infected primary human macrophages driven intracellularly by P. aeruginosa strains.
HMDMs were infected with GFP expressing PAO1 WT, ΔoprF, and ΔpscN strains. After phagocytosis, cells were maintained in RPMI supplemented with gentamicin. Cells were imaged 2 hrs post-phagocytosis after staining with phalloidin (A) and lysis was quantified (B) by counting infected cells lacking cortical labeling (indicated by arrows). Scale bar is equivalent to 10 μm. Percentage of lysed cells with intracellular bacteria out of total number of infected cells was plotted. Error bars correspond to standard errors from two independent experiments. At least 200 cells were counted per strain. The asterisks indicate P values (One way ANOVA, where all strains were compared to WT using Bonferroni’s multiple comparison test, ***P <0.001), showing statistical significance with respect to WT.
Fig 8
Fig 8. Assessment of access of P. aeruginosa to host cytosol using phagosome escape assay.
J774 macrophages were infected with PAO1 WT, ΔmgtC, ΔoprF and ΔpscN strains. After phagocytosis, cells were stained with CCF4-AM in presence of gentamicin. 2 hrs post-phagocytosis, the cells were imaged with 10X objective using FITC and DAPI channels. Upon escape of bacteria from phagosome to the cytosol, the CCF4-AM FRET is lost, producing blue color. (A) Representative pictures are shown with the following channels: Total cell population is shown in merged green and blue cells, whereas cells with cleaved CCF4 probe are shown in blue in the lower panel. Scale bar is equivalent to 50 μm. (B) Images were analyzed and quantified by Cell Profiler software to calculate the percentage of blue cells out of total green cells. At least 200 cells were counted per strain. Error bars correspond to standard errors from three independent experiments. The asterisks indicate P values (One way ANOVA, where all strains were compared to WT using Dunnett’s multiple comparison post-test, **P <0.01 and ***P <0.001), showing statistical significance with respect to WT. (C) Electron micrograph showing a disrupted vacuole membrane (white arrows) in a macrophage infected with PAO1 strain. The right panel shows higher magnification of the black square in the left panel.
Fig 9
Fig 9. Model for intramacrophage fate of P. aeruginosa.
Phagocytosed P. aeruginosa PAO1 first resides in a vacuole, before escaping the phagosome and promoting macrophage lysis. This cell lysis driven by intracellular P. aeruginosa involves the T3SS and more specifically ExoS. MgtC and OprF act positively on the expression of T3SS, possibly by reducing c-di-GMP level, a negative regulator of T3SS expression. Thereby T3SS and its effector ExoS play a role in phagosomal escape and cell lysis. Further work will be required to address secretion of ExoS from intracellularly expressed T3SS as well as identify host targets.

Similar articles

Cited by

References

    1. Silva MT (2012) Classical labeling of bacterial pathogens according to their lifestyle in the host: inconsistencies and alternatives. Front Microbiol 3: 71 10.3389/fmicb.2012.00071 - DOI - PMC - PubMed
    1. Pujol C, Bliska JB (2005) Turning Yersinia pathogenesis outside in: subversion of macrophage function by intracellular yersiniae. Clin Immunol 114: 216–226. 10.1016/j.clim.2004.07.013 - DOI - PubMed
    1. Kubica M, Guzik K, Koziel J, Zarebski M, Richter W, et al. (2008) A potential new pathway for Staphylococcus aureus dissemination: the silent survival of S. aureus phagocytosed by human monocyte-derived macrophages. PLoS One 3: e1409 10.1371/journal.pone.0001409 - DOI - PMC - PubMed
    1. Garzoni C, Kelley WL (2009) Staphylococcus aureus: new evidence for intracellular persistence. Trends Microbiol 17: 59–65. 10.1016/j.tim.2008.11.005 - DOI - PubMed
    1. Flannagan RS, Heit B, Heinrichs DE (2016) Intracellular replication of Staphylococcus aureus in mature phagolysosomes in macrophages precedes host cell death, and bacterial escape and dissemination. Cell Microbiol 18: 514–535. 10.1111/cmi.12527 - DOI - PubMed

Publication types

MeSH terms