

Validation strategies for target prediction methods
- PMID: 31220208
- PMCID: PMC7299289
- DOI: 10.1093/bib/bbz026
Validation strategies for target prediction methods
Abstract
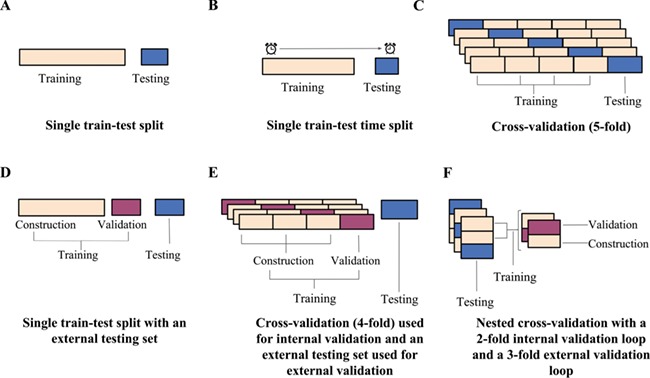
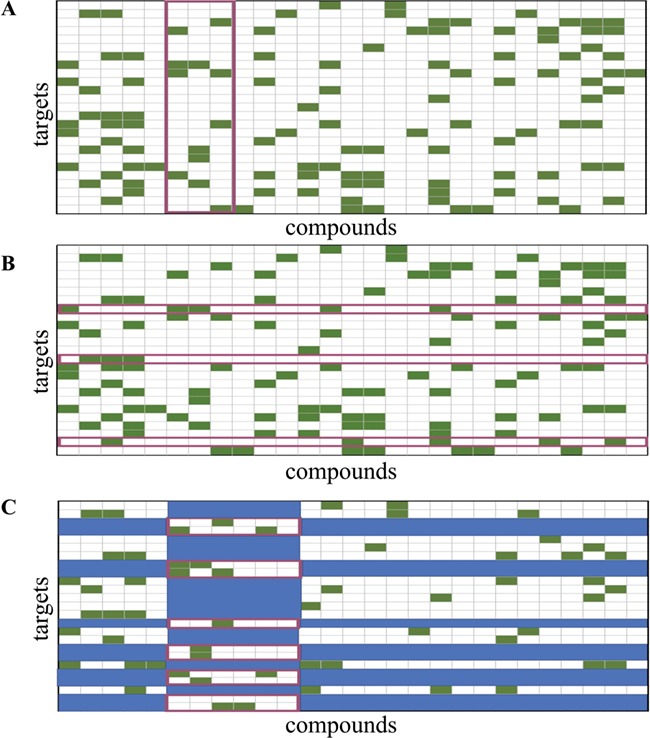
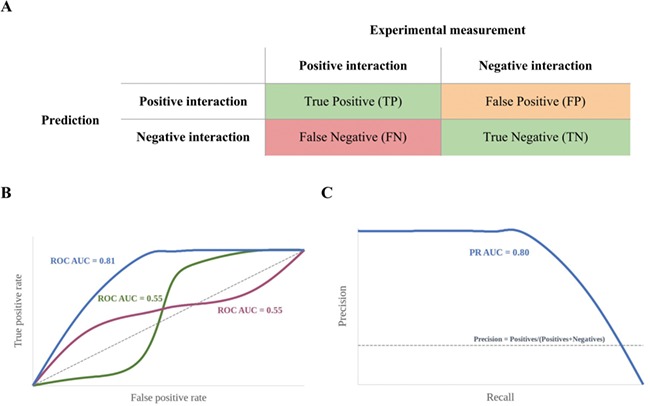
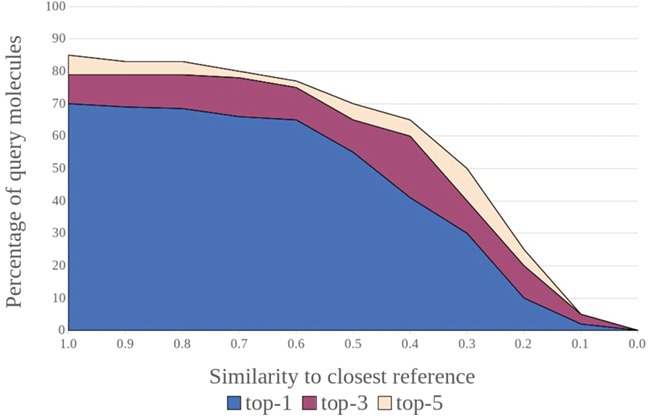
Computational methods for target prediction, based on molecular similarity and network-based approaches, machine learning, docking and others, have evolved as valuable and powerful tools to aid the challenging task of mode of action identification for bioactive small molecules such as drugs and drug-like compounds. Critical to discerning the scope and limitations of a target prediction method is understanding how its performance was evaluated and reported. Ideally, large-scale prospective experiments are conducted to validate the performance of a model; however, this expensive and time-consuming endeavor is often not feasible. Therefore, to estimate the predictive power of a method, statistical validation based on retrospective knowledge is commonly used. There are multiple statistical validation techniques that vary in rigor. In this review we discuss the validation strategies employed, highlighting the usefulness and constraints of the validation schemes and metrics that are employed to measure and describe performance. We address the limitations of measuring only generalized performance, given that the underlying bioactivity and structural data are biased towards certain small-molecule scaffolds and target families, and suggest additional aspects of performance to consider in order to produce more detailed and realistic estimates of predictive power. Finally, we describe the validation strategies that were employed by some of the most thoroughly validated and accessible target prediction methods.
Keywords: classification; data bias; model validation; performance metrics; polypharmacology; target prediction.
© The Author(s) 2019. Published by Oxford University Press.
Figures
Similar articles
-
KinasePred: A Computational Tool for Small-Molecule Kinase Target Prediction.Int J Mol Sci. 2025 Feb 27;26(5):2157. doi: 10.3390/ijms26052157. Int J Mol Sci. 2025. PMID: 40076779 Free PMC article.
-
Identification and validation of bioactive small molecule target through phenotypic screening.Bioorg Med Chem. 2012 Mar 15;20(6):1922-8. doi: 10.1016/j.bmc.2011.11.021. Epub 2011 Nov 20. Bioorg Med Chem. 2012. PMID: 22153994
-
Improved machine learning models for predicting selective compounds.J Chem Inf Model. 2012 Jan 23;52(1):38-50. doi: 10.1021/ci200346b. Epub 2011 Dec 23. J Chem Inf Model. 2012. PMID: 22107358
-
Target identification of bioactive compounds.Bioorg Med Chem. 2012 Mar 15;20(6):1910-21. doi: 10.1016/j.bmc.2011.10.081. Epub 2011 Nov 4. Bioorg Med Chem. 2012. PMID: 22104438 Review.
-
Validation guidelines for drug-target prediction methods.Expert Opin Drug Discov. 2025 Jan;20(1):31-45. doi: 10.1080/17460441.2024.2430955. Epub 2024 Nov 21. Expert Opin Drug Discov. 2025. PMID: 39568436 Review.
Cited by
-
Integrating Artificial Intelligence for Drug Discovery in the Context of Revolutionizing Drug Delivery.Life (Basel). 2024 Feb 7;14(2):233. doi: 10.3390/life14020233. Life (Basel). 2024. PMID: 38398742 Free PMC article. Review.
-
In silico proof of principle of machine learning-based antibody design at unconstrained scale.MAbs. 2022 Jan-Dec;14(1):2031482. doi: 10.1080/19420862.2022.2031482. MAbs. 2022. PMID: 35377271 Free PMC article.
-
Scope of 3D Shape-Based Approaches in Predicting the Macromolecular Targets of Structurally Complex Small Molecules Including Natural Products and Macrocyclic Ligands.J Chem Inf Model. 2020 Jun 22;60(6):2858-2875. doi: 10.1021/acs.jcim.0c00161. Epub 2020 May 5. J Chem Inf Model. 2020. PMID: 32368908 Free PMC article.
-
Identification and Validation of Carbonic Anhydrase II as the First Target of the Anti-Inflammatory Drug Actarit.Biomolecules. 2020 Nov 19;10(11):1570. doi: 10.3390/biom10111570. Biomolecules. 2020. PMID: 33227945 Free PMC article.
-
Novel drug-target interactions via link prediction and network embedding.BMC Bioinformatics. 2022 Apr 4;23(1):121. doi: 10.1186/s12859-022-04650-w. BMC Bioinformatics. 2022. PMID: 35379165 Free PMC article.
References
-
- Moffat JG, Vincent F, Lee JA, et al. . Opportunities and challenges in phenotypic drug discovery: an industry perspective. Nat Rev Drug Discov 2017;16:531–543. - PubMed
-
- Anighoro A, Bajorath J, Rastelli G. Polypharmacology: challenges and opportunities in drug discovery. J Med Chem 2014;57:7874–7887. - PubMed
-
- Proschak E, Stark H, Merk D. Polypharmacology by design: a medicinal chemist’s perspective on multitargeting compounds. J Med Chem 2019;62:420–444. - PubMed
