

Genomic knockout of alms1 in zebrafish recapitulates Alström syndrome and provides insight into metabolic phenotypes
- PMID: 31220269
- PMCID: PMC6586141
- DOI: 10.1093/hmg/ddz053
Genomic knockout of alms1 in zebrafish recapitulates Alström syndrome and provides insight into metabolic phenotypes
Abstract
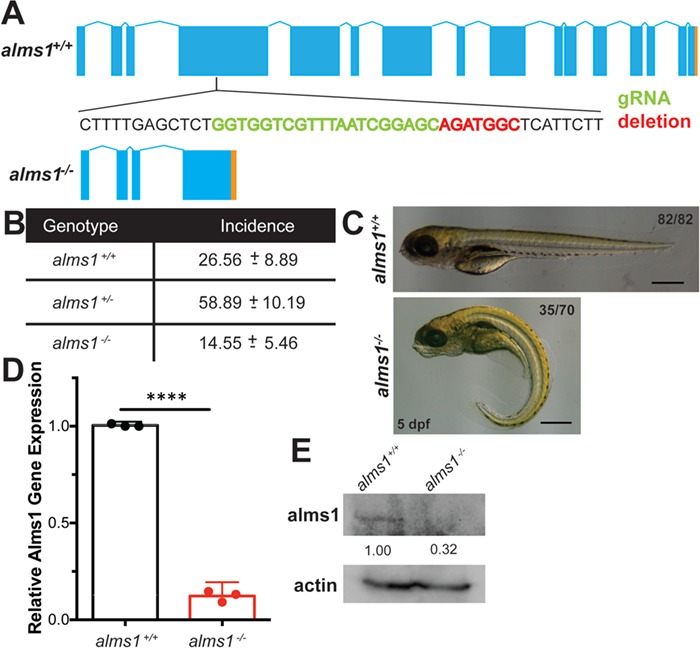
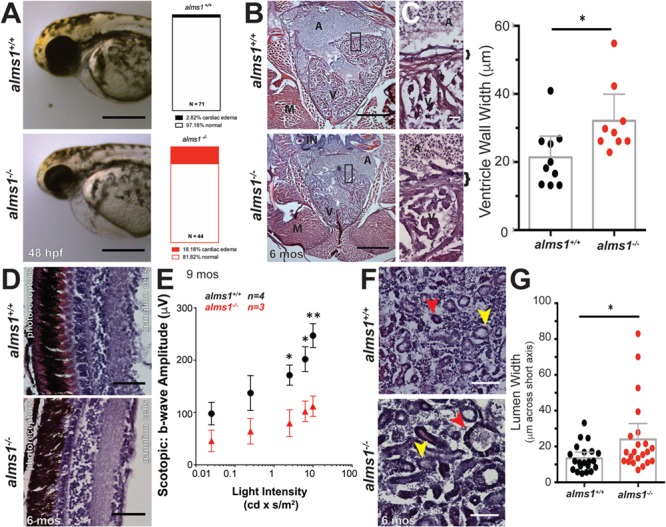
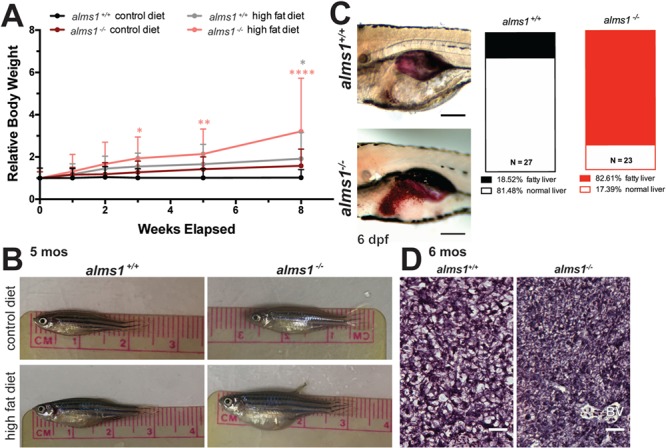
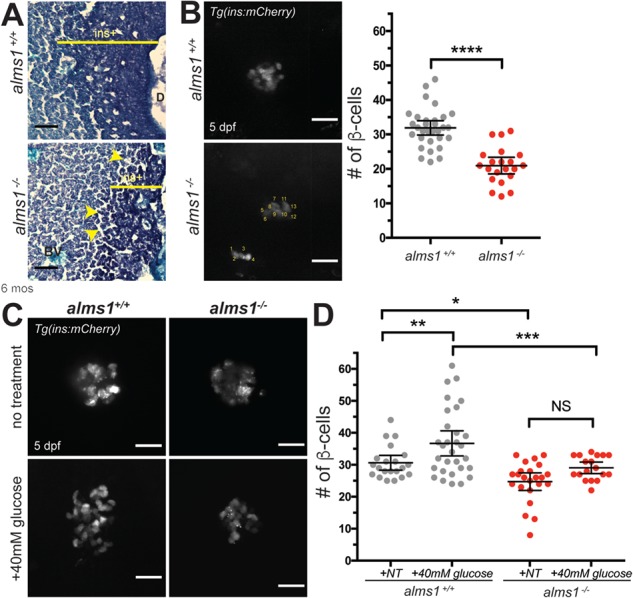
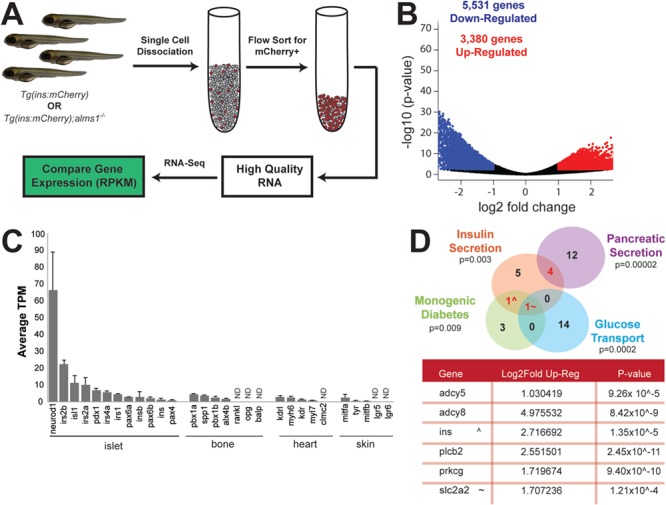
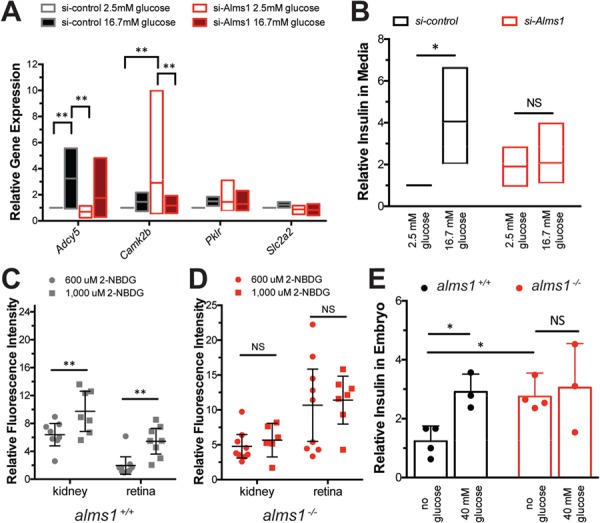
Alström syndrome (OMIM #203800) is an autosomal recessive obesity ciliopathy caused by loss-of-function mutations in the ALMS1 gene. In addition to multi-organ dysfunction, such as cardiomyopathy, retinal degeneration and renal dysfunction, the disorder is characterized by high rates of obesity, insulin resistance and early-onset type 2 diabetes mellitus (T2DM). To investigate the underlying mechanisms of T2DM phenotypes, we generated a loss-of-function deletion of alms1 in the zebrafish. We demonstrate conservation of hallmark clinical characteristics alongside metabolic syndrome phenotypes, including a propensity for obesity and fatty livers, hyperinsulinemia and glucose response defects. Gene expression changes in β-cells isolated from alms1-/- mutants revealed changes consistent with insulin hypersecretion and glucose sensing failure, which were corroborated in cultured murine β-cells lacking Alms1. We also found evidence of defects in peripheral glucose uptake and concomitant hyperinsulinemia in the alms1-/- animals. We propose a model in which hyperinsulinemia is the primary and causative defect underlying generation of T2DM associated with alms1 deficiency. These observations support the alms1 loss-of-function zebrafish mutant as a monogenic model for mechanistic interrogation of T2DM phenotypes.
© The Author(s) 2019. Published by Oxford University Press. All rights reserved. For Permissions, please email: journals.permissions@oup.com.
Figures
Similar articles
-
Alström syndrome: an ultra-rare monogenic disorder as a model for insulin resistance, type 2 diabetes mellitus and obesity.Endocrine. 2021 Mar;71(3):618-625. doi: 10.1007/s12020-021-02643-y. Epub 2021 Feb 10. Endocrine. 2021. PMID: 33566311 Review.
-
GLUT4 defects in adipose tissue are early signs of metabolic alterations in Alms1GT/GT, a mouse model for obesity and insulin resistance.PLoS One. 2014 Oct 9;9(10):e109540. doi: 10.1371/journal.pone.0109540. eCollection 2014. PLoS One. 2014. PMID: 25299671 Free PMC article.
-
Alms1-disrupted mice recapitulate human Alström syndrome.Hum Mol Genet. 2005 Aug 15;14(16):2323-33. doi: 10.1093/hmg/ddi235. Epub 2005 Jul 6. Hum Mol Genet. 2005. PMID: 16000322 Free PMC article.
-
Alström syndrome: insights into the pathogenesis of metabolic disorders.Nat Rev Endocrinol. 2011 Feb;7(2):77-88. doi: 10.1038/nrendo.2010.210. Epub 2010 Dec 7. Nat Rev Endocrinol. 2011. PMID: 21135875 Review.
-
Mesenchymal-specific Alms1 knockout in mice recapitulates metabolic features of Alström syndrome.Mol Metab. 2024 Jun;84:101933. doi: 10.1016/j.molmet.2024.101933. Epub 2024 Apr 6. Mol Metab. 2024. PMID: 38583571 Free PMC article.
Cited by
-
Alström syndrome: an ultra-rare monogenic disorder as a model for insulin resistance, type 2 diabetes mellitus and obesity.Endocrine. 2021 Mar;71(3):618-625. doi: 10.1007/s12020-021-02643-y. Epub 2021 Feb 10. Endocrine. 2021. PMID: 33566311 Review.
-
Ancestry-driven metabolite variation provides insights into disease states in admixed populations.Genome Med. 2023 Jul 17;15(1):52. doi: 10.1186/s13073-023-01209-z. Genome Med. 2023. PMID: 37461045 Free PMC article.
-
Zebrafish as a Model Organism for Studying Pathologic Mechanisms of Neurodegenerative Diseases and other Neural Disorders.Cell Mol Neurobiol. 2023 Aug;43(6):2603-2620. doi: 10.1007/s10571-023-01340-w. Epub 2023 Apr 1. Cell Mol Neurobiol. 2023. PMID: 37004595 Free PMC article. Review.
-
Primary Cilia in Pancreatic β- and α-Cells: Time to Revisit the Role of Insulin-Degrading Enzyme.Front Endocrinol (Lausanne). 2022 Jun 27;13:922825. doi: 10.3389/fendo.2022.922825. eCollection 2022. Front Endocrinol (Lausanne). 2022. PMID: 35832432 Free PMC article. Review.
-
Consensus clinical management guidelines for Alström syndrome.Orphanet J Rare Dis. 2020 Sep 21;15(1):253. doi: 10.1186/s13023-020-01468-8. Orphanet J Rare Dis. 2020. PMID: 32958032 Free PMC article.
References
-
- Adams M., Smith U.M., Logan C.V. and Johnson C.A. (2008) Recent advances in the molecular pathology, cell biology and genetics of ciliopathies. J. Med. Genet., 45, 257–267. - PubMed
-
- Alstrom C.H., Hallgren B., Nilsson L.B. and Asander H. (1959) Retinal degeneration combined with obesity, diabetes mellitus and neurogenous deafness: a specific syndrome (not hitherto described) distinct from the Laurence–Moon–Bardet–Biedl syndrome. Acta Psychiatr. Neurol. Scand. Suppl., 129, 1–35. - PubMed
Publication types
MeSH terms
Grants and funding
LinkOut - more resources
Full Text Sources
Medical
Molecular Biology Databases
