. 2020 Feb;71(2):611-626.
doi: 10.1002/hep.30827. Epub 2019 Aug 19.

Neuroinflammation in Murine Cirrhosis Is Dependent on the Gut Microbiome and Is Attenuated by Fecal Transplant

Affiliations

Neuroinflammation in Murine Cirrhosis Is Dependent on the Gut Microbiome and Is Attenuated by Fecal Transplant

Runping Liu et al. Hepatology. 2020 Feb.

Abstract

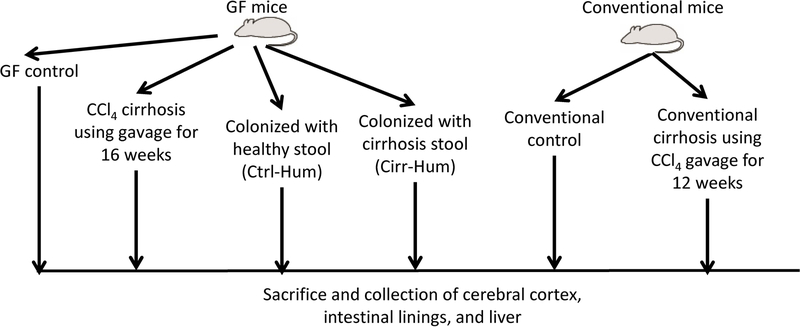
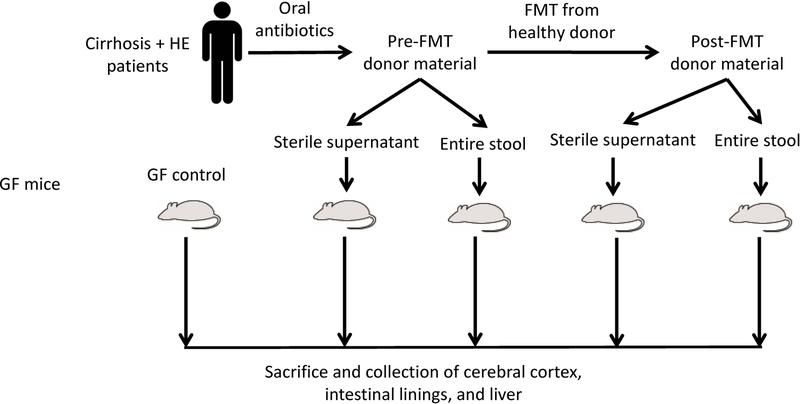
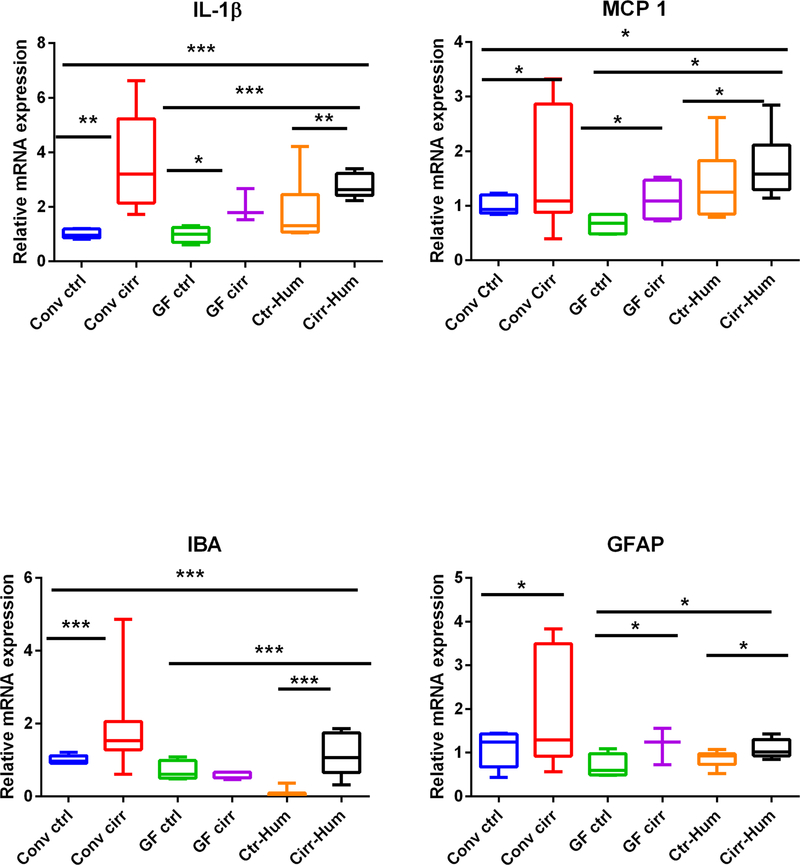
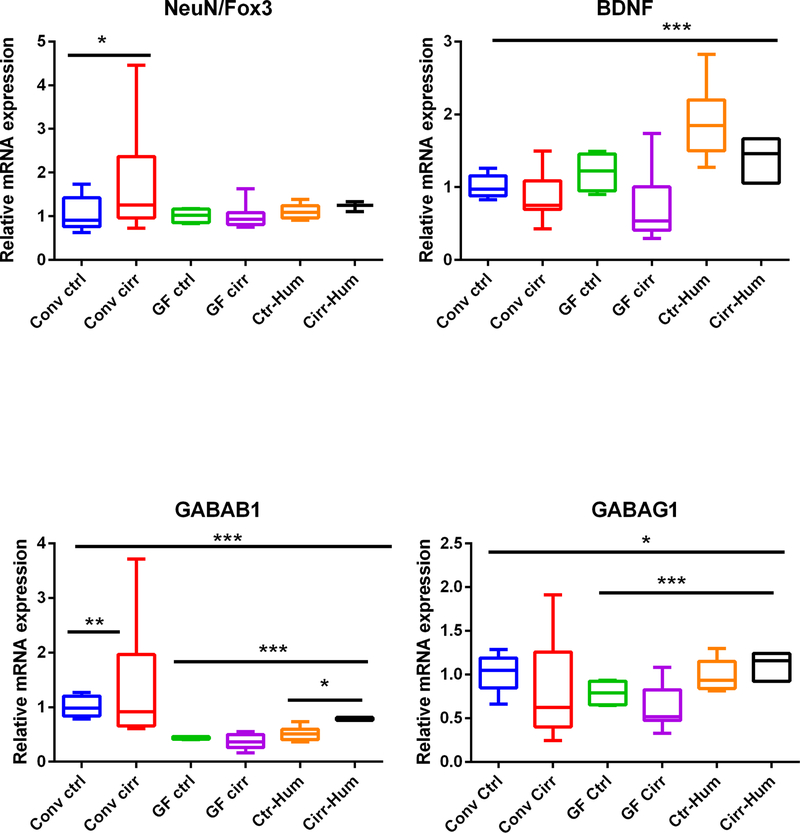
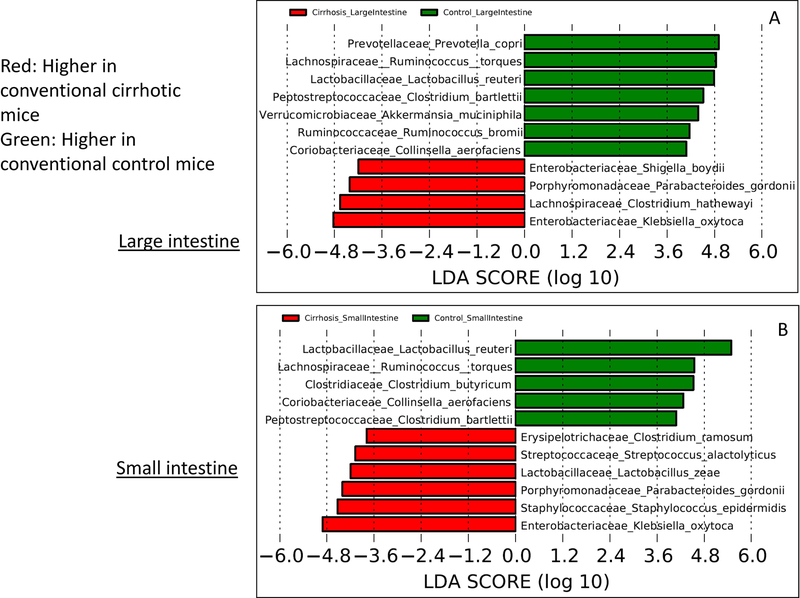
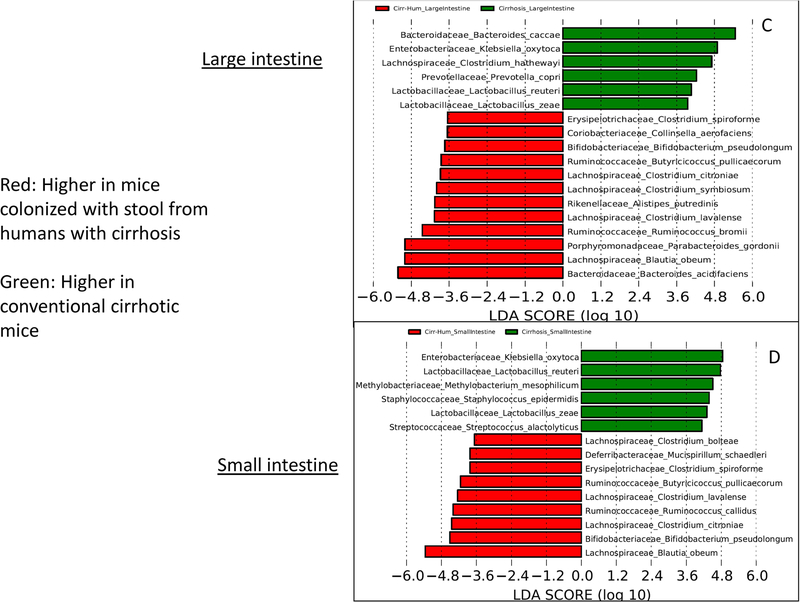
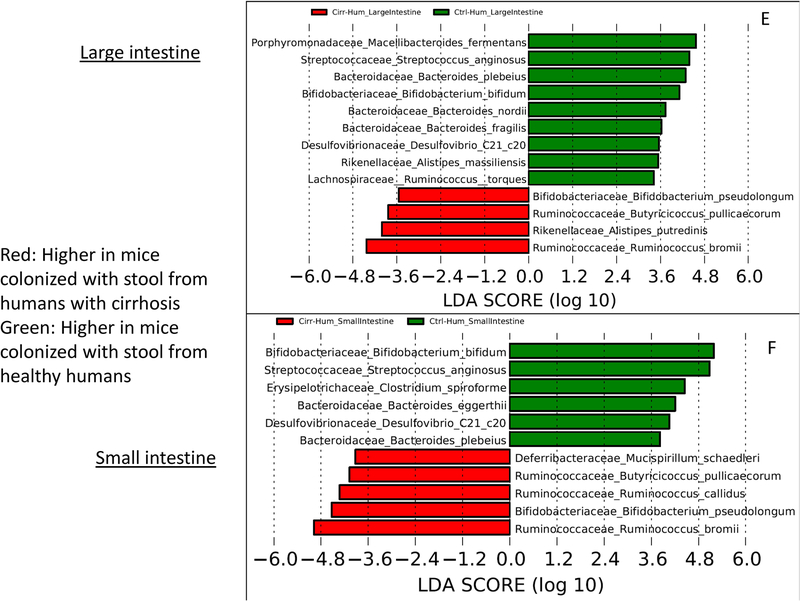
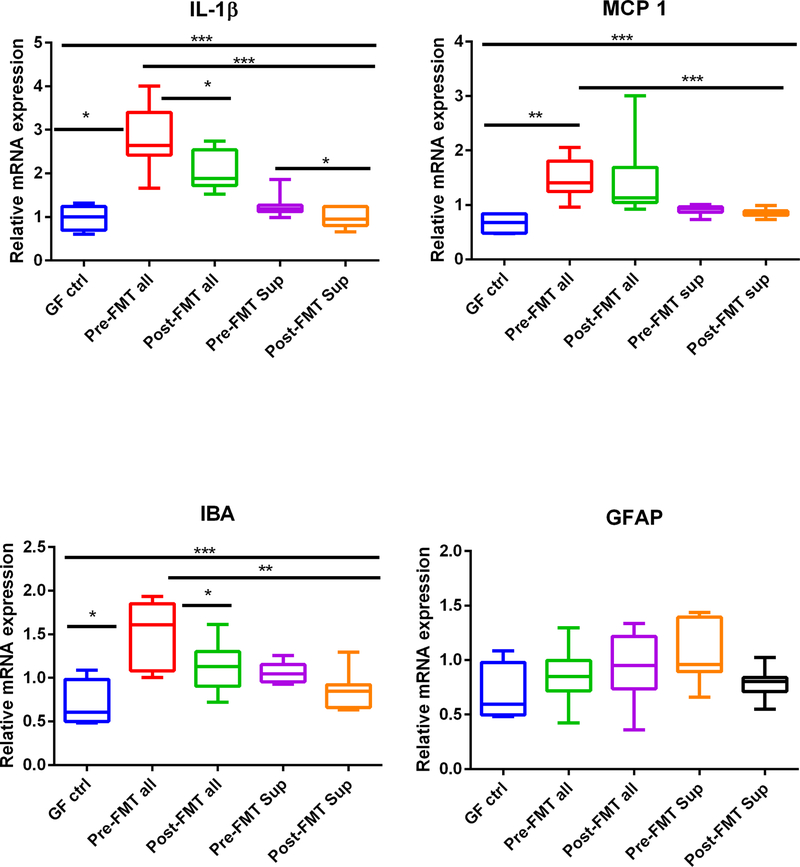
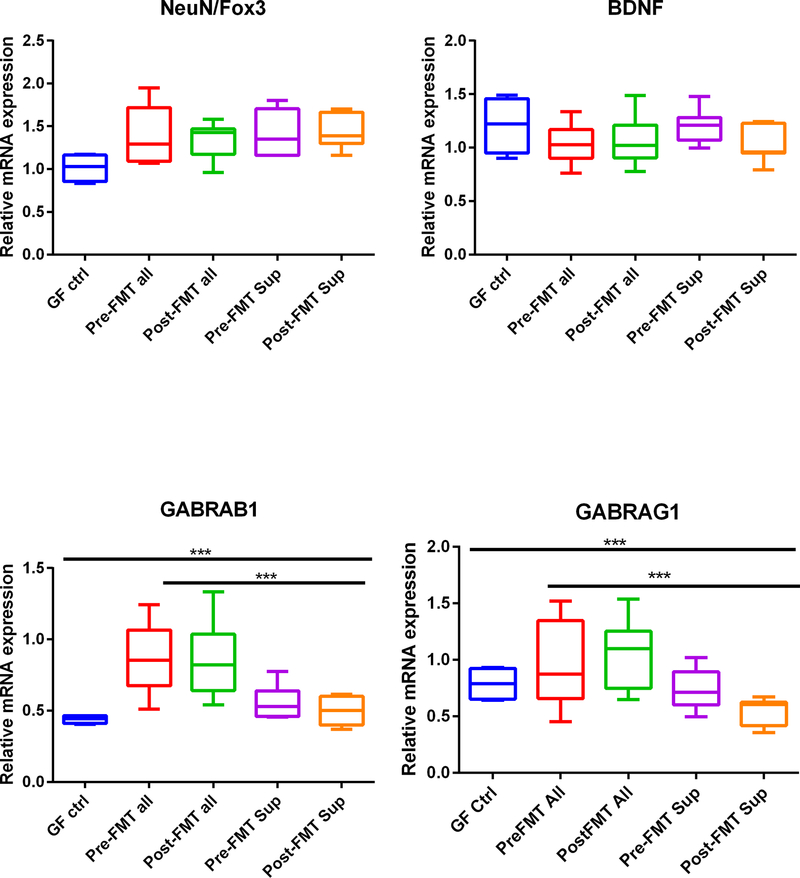
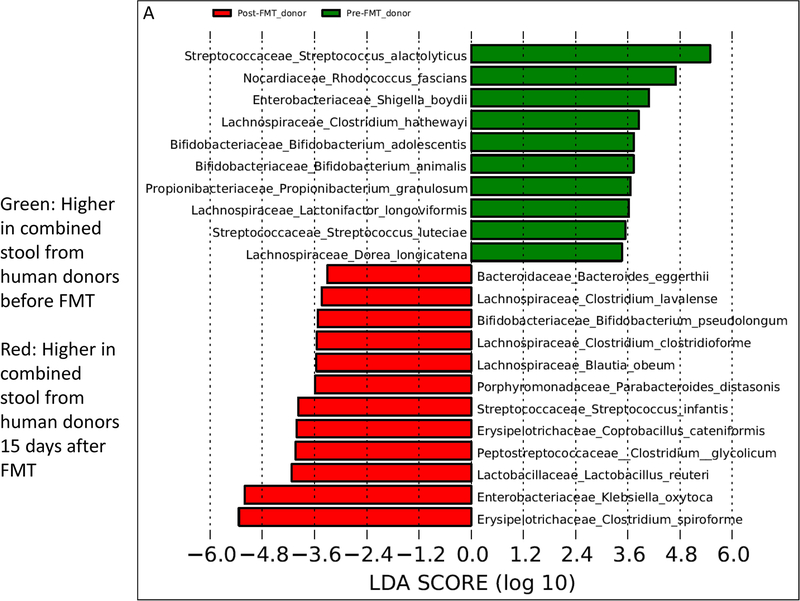
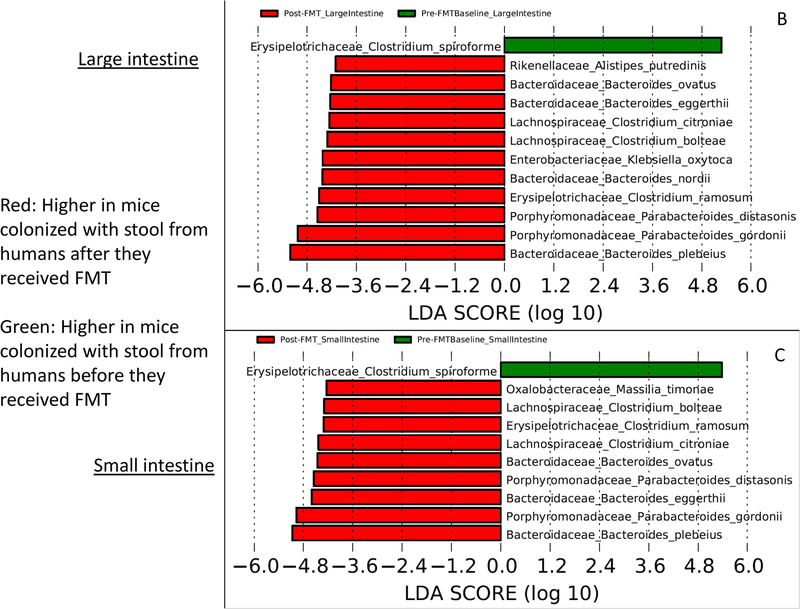
Cirrhosis and hepatic encephalopathy (HE) is associated with an altered gut-liver-brain axis. Fecal microbial transplant (FMT) after antibiotics improves outcomes in HE, but the impact on brain function is unclear. The aim of this study is to determine the effect of colonization using human donors in germ-free (GF) mice on the gut-liver-brain axis. GF and conventional mice were made cirrhotic using carbon tetrachloride and compared with controls in GF and conventional state. Additional GF mice were colonized with stool from controls (Ctrl-Hum) and patients with cirrhosis (Cirr-Hum). Stools from patients with HE cirrhosis after antibiotics were pooled (pre-FMT). Stools from the same patients 15 days after FMT from a healthy donor were also pooled (post-FMT). Sterile supernatants were created from pre-FMT and post-FMT samples. GF mice were colonized using stools/sterile supernatants. For all mice, frontal cortex, liver, and small/large intestines were collected. Cortical inflammation, synaptic plasticity and gamma-aminobutyric acid (GABA) signaling, and liver inflammation and intestinal 16s ribosomal RNA microbiota sequencing were performed. Conventional cirrhotic mice had higher degrees of neuroinflammation, microglial/glial activation, GABA signaling, and intestinal dysbiosis compared with other groups. Cirr-Hum mice had greater neuroinflammation, microglial/glial activation, and GABA signaling and lower synaptic plasticity compared with Ctrl-Hum mice. This was associated with greater dysbiosis but no change in liver histology. Pre-FMT material colonization was associated with neuroinflammation and microglial activation and dysbiosis, which was reduced significantly with post-FMT samples. Sterile pre-FMT and post-FMT supernatants did not affect brain parameters. Liver inflammation was unaffected. Conclusion: Fecal microbial colonization from patients with cirrhosis results in higher degrees of neuroinflammation and activation of GABAergic and neuronal activation in mice regardless of cirrhosis compared with those from healthy humans. Reduction in neuroinflammation by using samples from post-FMT patients to colonize GF mice shows a direct effect of fecal microbiota independent of active liver inflammation or injury.


Figures

FIG. 1
FIG. 1
Schematic of experiments. (A) Design of selective colonization experiment. (B) Fecal microbiota transplant experimental design. Abbreviations: CCl4, carbon tetrachloride; Cirr-Hum, mice colonized with stool from patients with cirrhosis with minimal hepatic encephalopathy; Ctrl-Hum, mice colonized with stool from healthy humans; FMT, fecal microbial transplant; GF, germ-free; HE, hepatic encephalopathy.
FIG. 1
FIG. 1
Schematic of experiments. (A) Design of selective colonization experiment. (B) Fecal microbiota transplant experimental design. Abbreviations: CCl4, carbon tetrachloride; Cirr-Hum, mice colonized with stool from patients with cirrhosis with minimal hepatic encephalopathy; Ctrl-Hum, mice colonized with stool from healthy humans; FMT, fecal microbial transplant; GF, germ-free; HE, hepatic encephalopathy.
FIG. 2
FIG. 2
Expression of mRNA in mouse frontal cortex. (A) IL-1β expression was highest in conventional cirrhotic mice compared to the rest and was even higher in Cirr-Hum mice compared to Ctrl-Hum and other GF mice. (B) Monocyte chemoattractant protein 1 (MCP1) expression was again highest in conv cirr group and in Cirr-Hum frontal cortex. (C) Ionized calcium-binding adaptor molecule 1 (IBA1) expression was also highest in conv cirr group and in Cirr-Hum frontal cortex. (D) Glial fibrillary acidic protein (GFAP) expression was highest in conv cirr group and in Cirr-Hum frontal cortex. (E) Neuronal N Fox 3 (NeuN/Fox3) expression was highest in conv cirrhosis compared to controls. No other significant differences were seen. (F) Brain-derived neurotrophic factor (BDNF) was only found to be high in Ctrl-Hum mice compared to the remaining GF mice. No other changes were seen. (G) GABA receptor, subunit B1 (GABAB1) was again highest in conv cirrhosis mice and in Cirr-Hum mice compared to the rest. (H) GABA receptor, subunit gamma 1 (GABAG1) expression was highest in Cirr-Hum and Ctrl-Hum mice compared to the remaining GF groups. Data are shown as median and 95% CI with comparisons using Kruskal-Wallis or Mann-Whitney tests. *P < 0.05, **P < 0.01, ***P < 0.001. Abbreviations: CCl4, carbon tetrachloride; Cirr-Hum, germ-free mice colonized with stool from patients with cirrhosis with minimal hepatic encephalopathy; conv cirr, conventional cirrhosis mice using CCl4 gavage; conv ctrl, conventional control mice; GF cirr, cirrhosis under germ-free conditions using Ctrl-Hum, germ-free mice colonized with stool from healthy humans; GF ctrl, germ-free control mice.
FIG. 2
FIG. 2
Expression of mRNA in mouse frontal cortex. (A) IL-1β expression was highest in conventional cirrhotic mice compared to the rest and was even higher in Cirr-Hum mice compared to Ctrl-Hum and other GF mice. (B) Monocyte chemoattractant protein 1 (MCP1) expression was again highest in conv cirr group and in Cirr-Hum frontal cortex. (C) Ionized calcium-binding adaptor molecule 1 (IBA1) expression was also highest in conv cirr group and in Cirr-Hum frontal cortex. (D) Glial fibrillary acidic protein (GFAP) expression was highest in conv cirr group and in Cirr-Hum frontal cortex. (E) Neuronal N Fox 3 (NeuN/Fox3) expression was highest in conv cirrhosis compared to controls. No other significant differences were seen. (F) Brain-derived neurotrophic factor (BDNF) was only found to be high in Ctrl-Hum mice compared to the remaining GF mice. No other changes were seen. (G) GABA receptor, subunit B1 (GABAB1) was again highest in conv cirrhosis mice and in Cirr-Hum mice compared to the rest. (H) GABA receptor, subunit gamma 1 (GABAG1) expression was highest in Cirr-Hum and Ctrl-Hum mice compared to the remaining GF groups. Data are shown as median and 95% CI with comparisons using Kruskal-Wallis or Mann-Whitney tests. *P < 0.05, **P < 0.01, ***P < 0.001. Abbreviations: CCl4, carbon tetrachloride; Cirr-Hum, germ-free mice colonized with stool from patients with cirrhosis with minimal hepatic encephalopathy; conv cirr, conventional cirrhosis mice using CCl4 gavage; conv ctrl, conventional control mice; GF cirr, cirrhosis under germ-free conditions using Ctrl-Hum, germ-free mice colonized with stool from healthy humans; GF ctrl, germ-free control mice.
FIG. 3
FIG. 3
Linear discriminant analysis (LDA) effect size (LEfSe) comparisons of microbiota at the species level using QIIME2. x axis shows the score that differentiates between the two groups being compared. A higher LDA toward one color indicates that taxon is higher in that group and lower in the group it is being compared to. (A) Comparison of conventional cirrhosis (red) to conventional control (green) mouse large intestinal mucosal microbiota. (B) Comparison of conventional cirrhosis (red) to conventional control (green) mouse small intestinal mucosal microbiota. (C) Comparison of conventional cirrhosis (green) to mice colonized with stool from cirrhotic humans with minimal hepatic encephalopathy (Cirr-Hum, red) in the mouse large intestinal mucosal microbiota. (D) Comparison of conventional cirrhosis (green) to mice colonized with stool from cirrhotic humans (Cirr-Hum, red) in the mouse small intestinal mucosal microbiota. (E) Comparison of large intestinal microbiota of mice colonized with stool from cirrhotic humans (Cirr-Hum, red) to those colonized with stool from healthy controls (Ctrl-Hum, green). (F) Comparison of small intestinal microbiota of mice colonized with stool from cirrhotic humans (Cirr-Hum, red) to those colonized with stool from healthy controls (Ctrl-Hum, green).
FIG. 3
FIG. 3
Linear discriminant analysis (LDA) effect size (LEfSe) comparisons of microbiota at the species level using QIIME2. x axis shows the score that differentiates between the two groups being compared. A higher LDA toward one color indicates that taxon is higher in that group and lower in the group it is being compared to. (A) Comparison of conventional cirrhosis (red) to conventional control (green) mouse large intestinal mucosal microbiota. (B) Comparison of conventional cirrhosis (red) to conventional control (green) mouse small intestinal mucosal microbiota. (C) Comparison of conventional cirrhosis (green) to mice colonized with stool from cirrhotic humans with minimal hepatic encephalopathy (Cirr-Hum, red) in the mouse large intestinal mucosal microbiota. (D) Comparison of conventional cirrhosis (green) to mice colonized with stool from cirrhotic humans (Cirr-Hum, red) in the mouse small intestinal mucosal microbiota. (E) Comparison of large intestinal microbiota of mice colonized with stool from cirrhotic humans (Cirr-Hum, red) to those colonized with stool from healthy controls (Ctrl-Hum, green). (F) Comparison of small intestinal microbiota of mice colonized with stool from cirrhotic humans (Cirr-Hum, red) to those colonized with stool from healthy controls (Ctrl-Hum, green).
FIG. 4
FIG. 4
Expression of mRNA in mouse frontal cortex. (A) IL-1β expression was highest in pre-FMT all mice, which reduced after post-FMT. This was higher than other GF groups, including the supernatants. The pre-FMT supernatant was also associated with higher IL-1β compared to post-FMT supernatants. (B) Monocyte chemoattractant protein 1 (MCP1) expression was higher in pre- and post-FMT all compared to GF mice regardless of whether they were given the supernatants or not. (C) Ionized calcium-binding adaptor molecule 1 (IBA1) expression was highest in pre-FMT all mice, which reduced post-FMT. This was higher than other GF groups, including the supernatants. (D) Glial fibrillary acidic protein (GFAP) expression was not different between groups. (E) Neuronal N Fox 3 (NeuN/Fox3) expression was not different between groups. (F) Brain-derived neurotrophic factor (BDNF) was not different between groups. (G) GABA receptor, subunit B1 (GABAB1) was higher in pre- and post-FMT all compared to GF mice regardless of whether they were given the supernatants or not. (G) GABA receptor, subunit gamma 1 (GABAG1) expression was higher in pre- and post-FMT all compared to GF mice regardless of whether they were given the supernatants or not. Data are shown as median and 95% CI with comparisons using Kruskal-Wallis or Mann-Whitney tests, *P < 0.05, **P < 0.01, ***P < 0.001. Abbreviations: GF ctrl, germ-free control mice; post-FMT all, mixed stool from the same patients who gave stool for pre-FMT 15 days after FMT with a healthy human; post-FMT sup, germ-free supernatant of the stools in post-FMT all; pre-FMT all, mixed stool from patients with cirrhosis after antibiotics but before fecal microbial transplant (FMT); pre-FMT sup, germ-free supernatant derived from the stools from patients in pre-FMT all.
FIG. 4
FIG. 4
Expression of mRNA in mouse frontal cortex. (A) IL-1β expression was highest in pre-FMT all mice, which reduced after post-FMT. This was higher than other GF groups, including the supernatants. The pre-FMT supernatant was also associated with higher IL-1β compared to post-FMT supernatants. (B) Monocyte chemoattractant protein 1 (MCP1) expression was higher in pre- and post-FMT all compared to GF mice regardless of whether they were given the supernatants or not. (C) Ionized calcium-binding adaptor molecule 1 (IBA1) expression was highest in pre-FMT all mice, which reduced post-FMT. This was higher than other GF groups, including the supernatants. (D) Glial fibrillary acidic protein (GFAP) expression was not different between groups. (E) Neuronal N Fox 3 (NeuN/Fox3) expression was not different between groups. (F) Brain-derived neurotrophic factor (BDNF) was not different between groups. (G) GABA receptor, subunit B1 (GABAB1) was higher in pre- and post-FMT all compared to GF mice regardless of whether they were given the supernatants or not. (G) GABA receptor, subunit gamma 1 (GABAG1) expression was higher in pre- and post-FMT all compared to GF mice regardless of whether they were given the supernatants or not. Data are shown as median and 95% CI with comparisons using Kruskal-Wallis or Mann-Whitney tests, *P < 0.05, **P < 0.01, ***P < 0.001. Abbreviations: GF ctrl, germ-free control mice; post-FMT all, mixed stool from the same patients who gave stool for pre-FMT 15 days after FMT with a healthy human; post-FMT sup, germ-free supernatant of the stools in post-FMT all; pre-FMT all, mixed stool from patients with cirrhosis after antibiotics but before fecal microbial transplant (FMT); pre-FMT sup, germ-free supernatant derived from the stools from patients in pre-FMT all.
FIG. 5
FIG. 5
Linear discriminant analysis effect size (LEfSe) comparisons of microbiota at the species level using QIIME2. x axis shows the score that differentiates between the two groups being compared. A higher LDA toward one color indicates that taxon is higher in that group and lower in the group it is being compared to. (A) Comparison between pre-FMT human donor stool (red) and post-FMT human donor stool (green). (B) Comparison between large intestine of mice colonized with pre-FMT donor stool (green) and post-FMT donor stool (red). (C) Comparison between small intestine of mice colonized with pre-FMT donor stool (green) and post-FMT donor stool (red)
FIG. 5
FIG. 5
Linear discriminant analysis effect size (LEfSe) comparisons of microbiota at the species level using QIIME2. x axis shows the score that differentiates between the two groups being compared. A higher LDA toward one color indicates that taxon is higher in that group and lower in the group it is being compared to. (A) Comparison between pre-FMT human donor stool (red) and post-FMT human donor stool (green). (B) Comparison between large intestine of mice colonized with pre-FMT donor stool (green) and post-FMT donor stool (red). (C) Comparison between small intestine of mice colonized with pre-FMT donor stool (green) and post-FMT donor stool (red)

Similar articles

Cited by

References

    1. Bajaj JS, Betrapally NS, Gillevet PM. Decompensated cirrhosis and microbiome interpretation. Nature 2015;525:E1–2. - PMC - PubMed
    1. Bajaj JS, Schubert CM, Heuman DM, Wade JB, Gibson DP, Topaz A, Saeian K, et al. Persistence of cognitive impairment after resolution of overt hepatic encephalopathy. Gastroenterology 2010;138:2332–2340. - PMC - PubMed
    1. Riggio O, Ridola L, Pasquale C, Nardelli S, Pentassuglio I, Moscucci F, Merli M. Evidence of persistent cognitive impairment after resolution of overt hepatic encephalopathy. Clin Gastroenterol Hepatol 2011;9:181–183. - PubMed
    1. Bajaj JS, Sanyal AJ, Bell D, Gilles H, Heuman DM. Predictors of the recurrence of hepatic encephalopathy in lactulose-treated patients. Aliment Pharmacol Ther 2010;31:1012–1017. - PubMed
    1. Vilstrup H, Amodio P, Bajaj J, Cordoba J, Ferenci P, Mullen KD, Weissenborn K, et al. Hepatic encephalopathy in chronic liver disease: 2014 Practice Guideline by the American Association for the Study of Liver Diseases and the European Association for the Study of the Liver. Hepatology 2014;60:715–735. - PubMed

Publication types