. 2019 Sep;189(9):1721-1731.
doi: 10.1016/j.ajpath.2019.05.020. Epub 2019 Jun 18.

The Protective Role of Natriuretic Peptide Receptor 2 against High Salt Injury in the Renal Papilla

Affiliations

The Protective Role of Natriuretic Peptide Receptor 2 against High Salt Injury in the Renal Papilla

George J Dugbartey et al. Am J Pathol. 2019 Sep.

Abstract

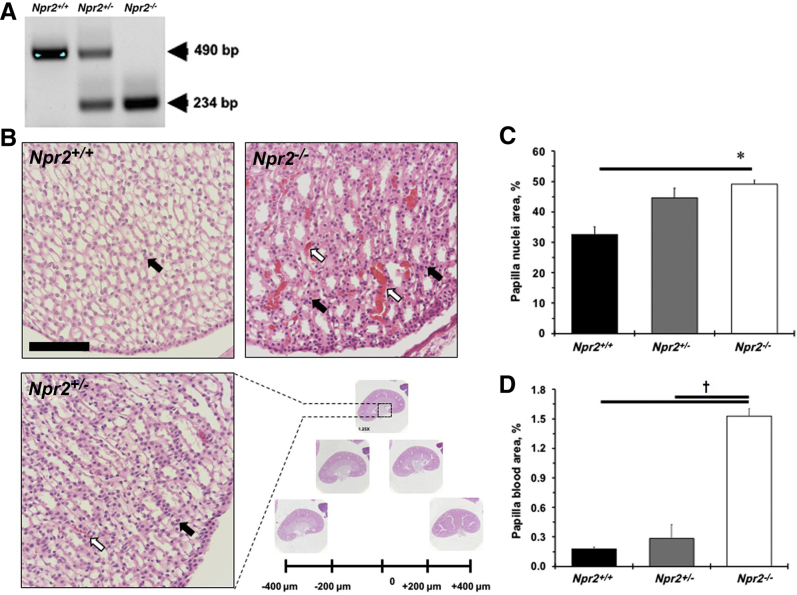
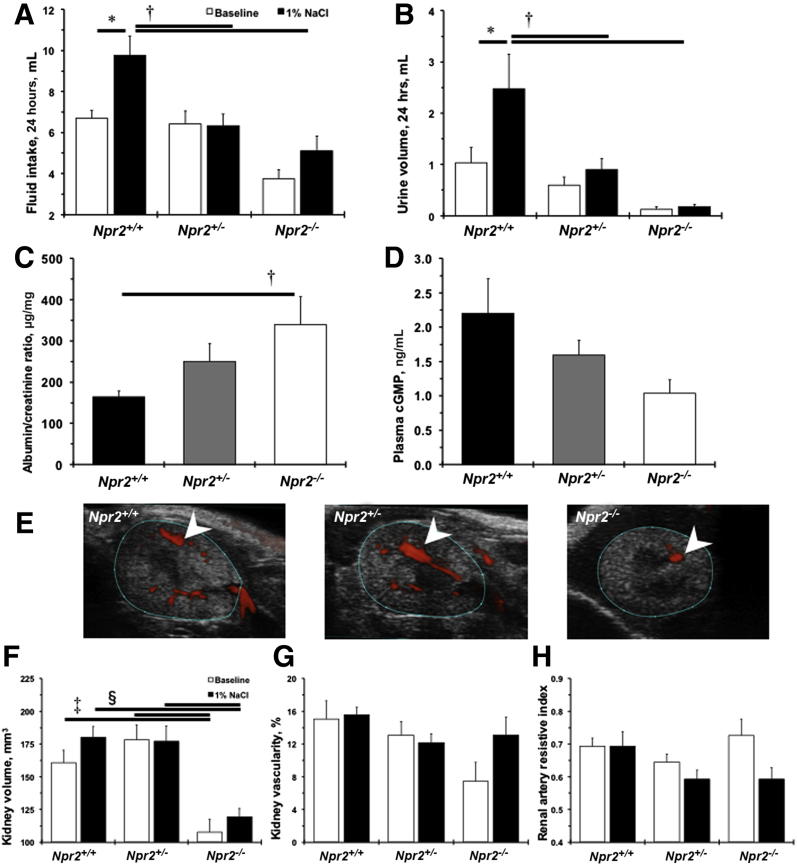
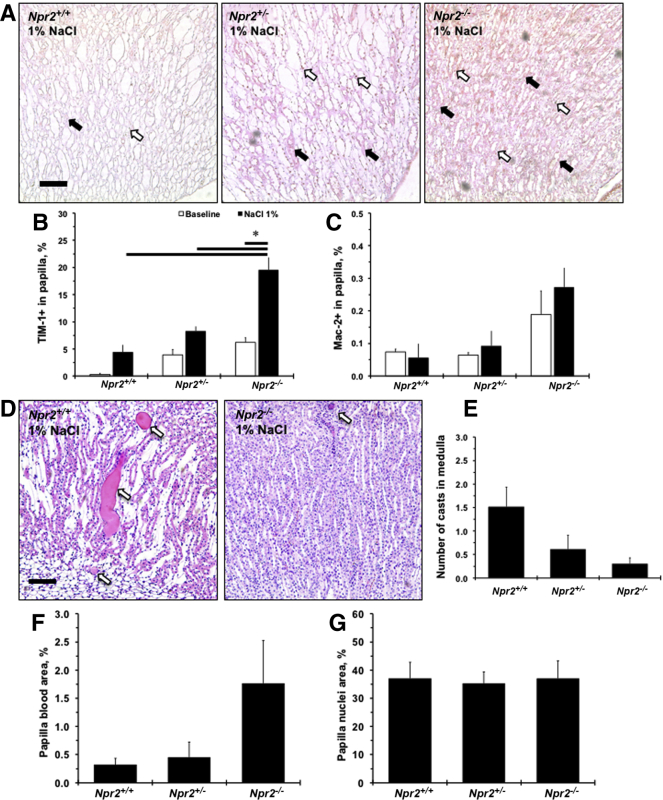
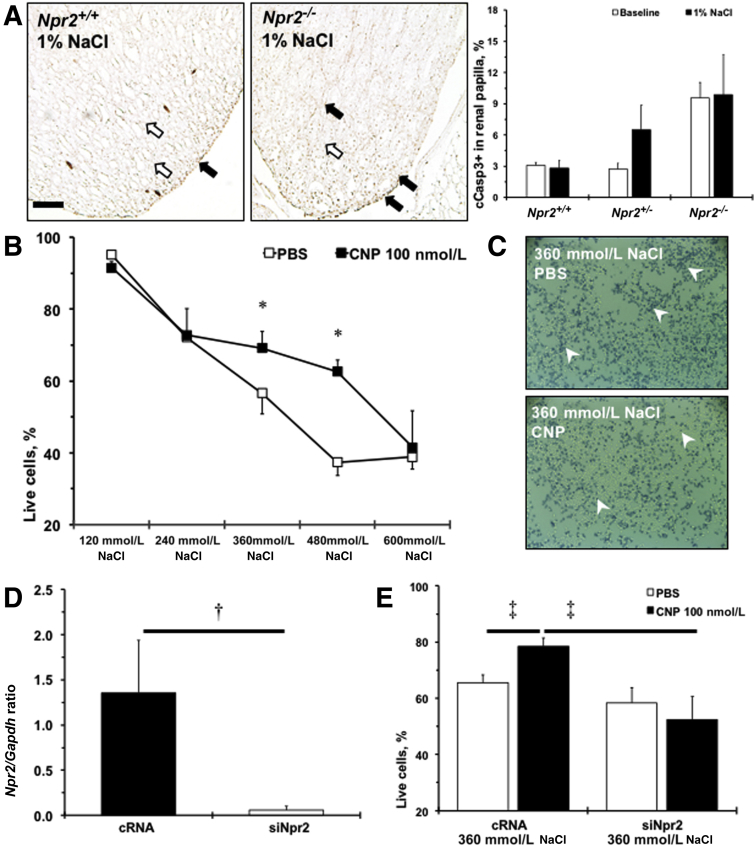
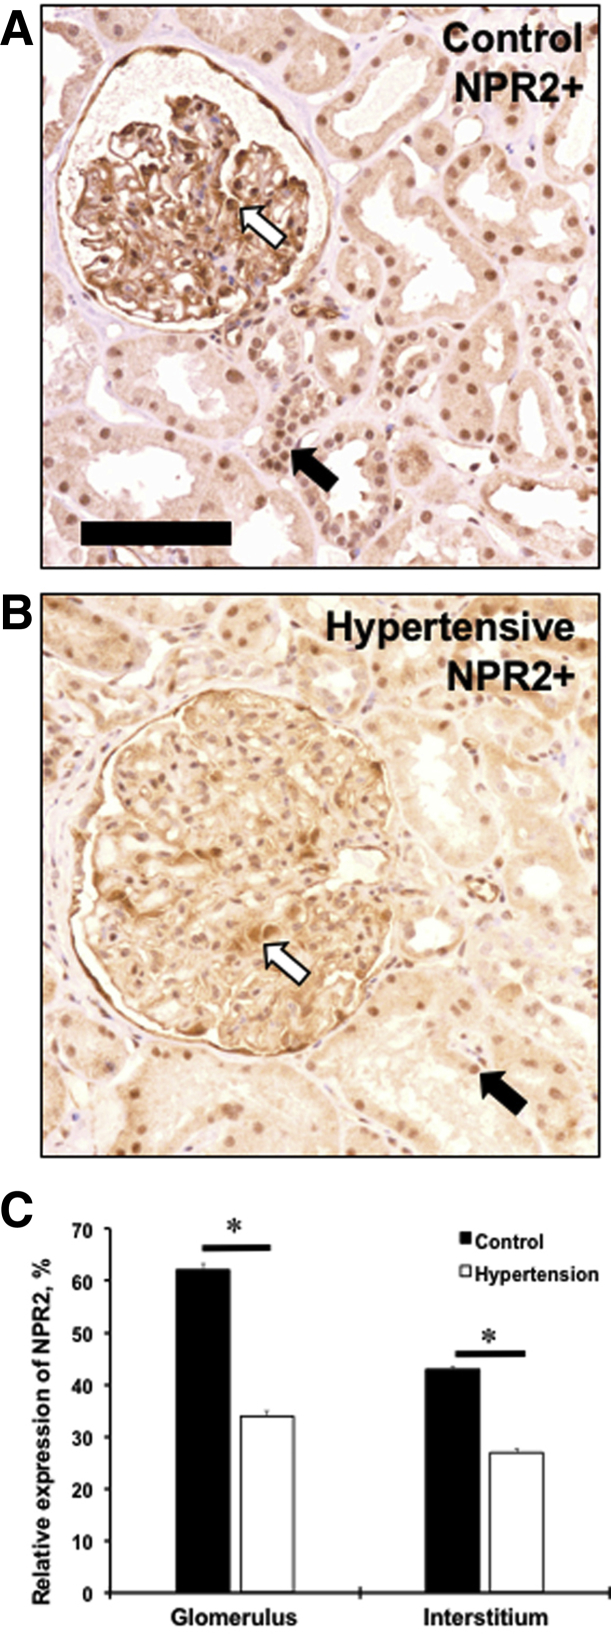
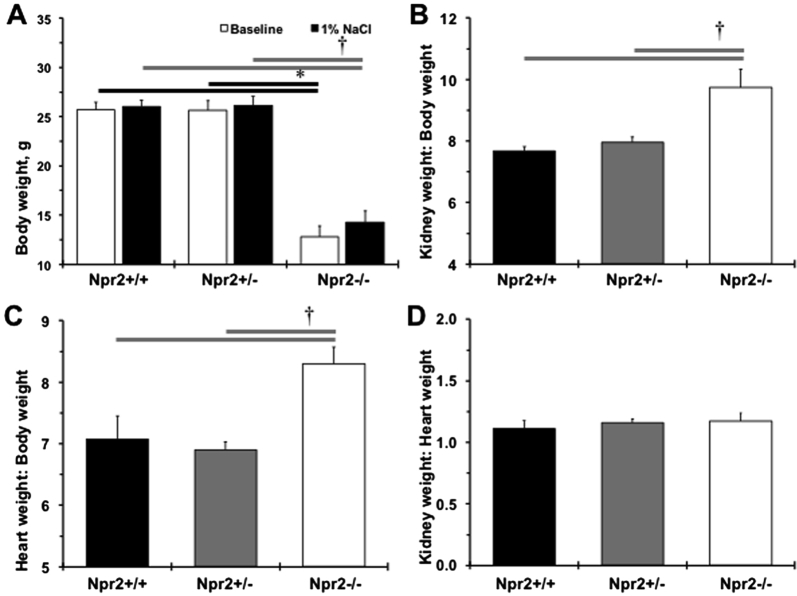
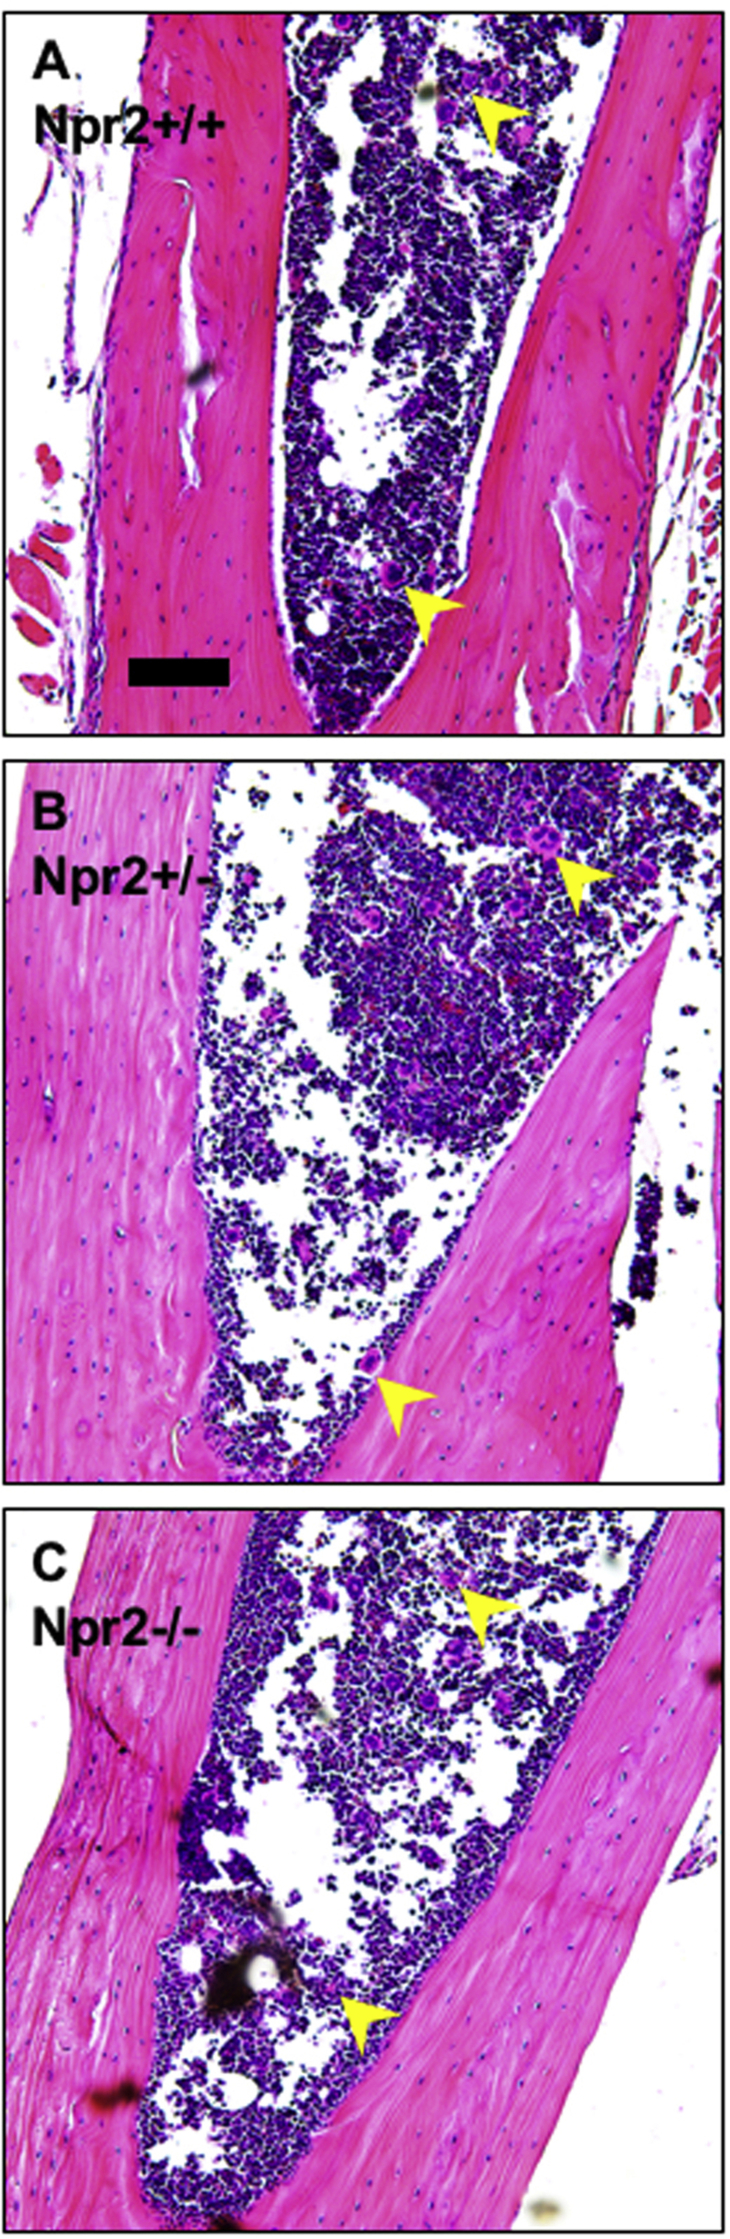
Mutations in natriuretic peptide receptor 2 (Npr2) gene cause a rare form of short-limbed dwarfism, but its physiological effects have not been well studied. Human and mouse genetic data suggest that Npr2 in the kidney plays a role in salt homeostasis. Herein, we described anatomic changes within renal papilla of Npr2 knockout (Npr2-/-) mice. Dramatic reduction was found in diuresis, and albuminuria was evident after administration of 1% NaCl in drinking water in Npr2-/- and heterozygous (Npr2+/-) mice compared with their wild-type (Npr2+/+) littermates. There was indication of renal epithelial damage accompanied by high numbers of red blood cells and inflammatory cells (macrophage surface glycoproteins binding to galectin-3) and an increase of renal epithelial damage marker (T-cell Ig and mucin domain 1) in Npr2-/- mice. Addition of 1% NaCl tended to increase apoptotic cells (cleaved caspase 3) in the renal papilla of Npr2-/- mice. In vitro, genetic silencing of the Npr2 abolished protective effects of C-type natriuretic peptide, a ligand for Npr2, against death of M-1 kidney epithelial cells exposed to 360 mmol/L NaCl. Finally, significantly lower levels of expression of the NPR2 protein were detected in renal samples of hypertensive compared with normotensive human subjects. Taken together, these findings suggest that Npr2 is essential to protect renal epithelial cells from high concentrations of salt and prevent kidney injury.


Figures

Figure 1
Figure 1
Deletion of the Npr2 gene leads to renal papilla abnormality. A: A representative gel shows results of genotyping Npr2 wild-type (Npr2+/+), heterozygous (Npr2+/−), and knockout (Npr2−/−) littermates. Teal markings are PCR products in bp. B: A quantification strategy of series of kidney sections every 200 μm. Dotted boxed area highlights a portion of a magnified renal papilla. White arrows point to blood in renal papilla. Black arrows point to nuclei in renal papilla. C: Quantification of nuclei area in renal papilla. D: Quantification of blood area in renal papilla. Black bars are Npr2+/+ mice. Gray bars are Npr2+/− mice. White bars are Npr2−/− mice. Data are expressed as means ± SEM (C and D). n = 5 per group (C and D). P < 0.05 versus Npr2+/+; P < 0.05 versus Npr2−/−. Scale bar = 100 μm (B).
Figure 2
Figure 2
Lack of Npr2 worsens kidney dysfunction in response to salt. A: Fluid intake for 24 hours across Npr2 mice. B: Urine volume for 24 hours across Npr2 mice. White bars are baseline values. Black bars are values after 2 weeks of intake of 1% NaCl in drinking water. C and D: A ratio of urine albumin/plasma creatinine (C) and plasma cGMP (D) across Npr2 genotypes after 2 weeks of 1% NaCl intake in drinking water. Black bars are Npr2 wild-type (Npr2+/+) mice. Gray bars are Npr2 heterozygous (Npr2+/−) mice. White bars are Npr2 knockout (Npr2−/−) mice. E: Representative ultrasound images of a transverse plane of kidneys across Npr2 mice. Blue outlined areas define kidney boundaries. White arrowheads point to vascularity. F: Kidney volumes based on 3-dimensional (3D) imaging of the kidneys across Npr2 genotypes. G: Percentages of the kidney vasculature based on 3D imaging of the kidneys across Npr2 genotypes. H: Renal artery resistive index based on ultrasound imaging across Npr2 genotypes. White bars are baseline values. Black bars are values after 2 weeks of 1% NaCl intake in drinking water. Data are expressed as means ± SEM. n = 7 to 11 per group (A, B, and FG); n = 5 to 9 per group (C and D). P < 0.05 versus Npr2+/+ (baseline); P < 0.05 versus Npr2+/+ (1% NaCl); P < 0.05 versus Npr2−/− (baseline); §P < 0.05 versus Npr2−/− (1% NaCl).
Figure 3
Figure 3
Histologic evaluation of renal papillary injury across Npr2 genotypes in response to salt. A: Representative images of double-stained [macrophage surface glycoproteins binding to galectin-3 (Mac-2) and T-cell Ig and mucin domain 1 (TIM-1)] kidney papilla across Npr2 genotypes after 1% NaCl intake in drinking water for 2 weeks. White arrows show Mac-2+ cells (brown). Black arrows show TIM-1+ staining (pink). Counterstain is green. B and C: Quantitative analysis of the TIM-1 (B) and Mac-2 (C) expression in the renal papilla in Npr2 mice. D: Representative images of hematoxylin and eosin–stained renal medulla of Npr2 wild-type (Npr2+/+) and Npr2 knockout (Npr2−/−) mice after 1% NaCl intake in drinking water for 2 weeks. White arrows point to protein casts. E: Quantitative analysis of protein casts in the renal medulla in Npr2 mice. No protein casts were detected at baseline. F: Quantification of blood in renal papilla in Npr2 mice. G: Quantification of nuclei area in renal papilla in Npr2 mice. White bars are baseline values. Black bars are values after 2 weeks of 1% NaCl intake in drinking water. Data are expressed as means ± SEM. n = 3 per group (B and C); n = 3 to 5 per group (EG). P < 0.05 versus Npr2−/− (1% NaCl). Scale bars = 100 μm (A and D). Npr2+/−, Npr2 heterozygous.
Figure 4
Figure 4
Npr2 protects renal epithelial cells against apoptosis in response to high salt. A: Representative images of cleaved caspase 3 staining (cCasp3; brown; black arrows) of renal papilla of Npr2 wild-type (Npr2+/+) and Npr2 knockout (Npr2−/−) mice after 1% NaCl intake in drinking water for 2 weeks. Counterstained nuclei are indicated by white arrows. Bar graph shows a quantitative analysis of cCasp3 expression in the renal papilla across experimental mice. White bars are baseline values. Black bars are values after 2 weeks of 1% NaCl intake in drinking water. B: C-type natriuretic peptide (CNP) protects M-1 cells from higher concentrations of NaCl in the medium. White squares show phosphate-buffered saline (PBS) treatment. Black squares show CNP (100 nmol/L) treatment. C: Representative images of trypan blue staining (white arrowheads) of treated M-1 cells at 360 mmol/L NaCl. D: Relative expression of Npr2 on gene silencing in M-1 cells. E:Npr2 depletion abolishes protective effects of CNP in M-1 cells at 360 mmol/L NaCl. White bars show PBS treatment. Black bars show CNP (100 nmol/L) treatment. Data are expressed as the means ± SEM. n = 3 per group (A and B); n = 3 to 4 per group (D and E). P < 0.05 versus PBS treatment; P < 0.05 versus complementary RNA (cRNA); P < 0.05 versus cRNA (CNP, 100 nmol/L). Scale bar = 100 μm (A). siNpr2, silencing of Npr2.
Figure 5
Figure 5
NPR2 expression is decreased in kidneys of hypertensive patients. A and B: Renal expression of NPR2 (brown staining) in control (A) and hypertensive (B) kidney samples. White arrows point to NPR2+ cells in glomerulus. Black arrows point to NPR2+ cells in interstitium. C: Quantification of NPR2 immunoreactivity in kidney compartments on x axis. Values are expressed as means ± SEM. n = 5 per group (C). P < 0.05 versus control. Scale bar = 100 μm (A and B).
Supplemental Figure S1
Changes in weights of Npr2 mice after 1% NaCl intake in drinking water for 2 weeks. A: Body weights across Npr2 genotypes. White bars show body weights at the baseline. Black bars show body weight after 2 weeks of 1% NaCl. BD: Relative kidney weight/body weight (B), heart weight/body weight (C), kidney weight/heart weight (D) ratios after 2 weeks of 1% NaCl administration. Black bars show Npr2 wild-type (Npr2+/+) mice. Gray bars show Npr2 heterozygous (Npr2+/−) mice. White bars show Npr2 knockout (Npr2−/−) mice. Data are expressed as means ± SEM (AD). n = 5 to 9 per group. P < 0.05 versus Npr2−/− (baseline); P < 0.05 versus Npr2−/− (1% NaCl).
Supplemental Figure S2
Bone marrow sections in Npr2 mice. Representative images of bone marrow across Npr2 wild-type (Npr2+/+; A), heterozygous (Npr2+/−; B), and knockout (Npr2−/−; C) mice. Yellow arrowheads point to megakaryocytes. Scale bar = 100 μm (AC).

Similar articles

Cited by

References

    1. Kinnunen P., Vuolteenaho O., Ruskoaho H. Mechanisms of atrial and brain natriuretic peptide release from rat ventricular myocardium: effect of stretching. Endocrinology. 1993;132:1961–1970. - PubMed
    1. Rosenzweig A., Seidman C.E. Atrial natriuretic factor and related peptide hormones. Annu Rev Biochem. 1991;60:229–255. - PubMed
    1. Brenner B.M., Ballermann B.J., Gunning M.E., Zeidel M.L. Diverse biological actions of atrial natriuretic peptide. Physiol Rev. 1990;70:665–699. - PubMed
    1. Inagami T. Atrial natriuretic factor. J Biol Chem. 1989;264:3043–3046. - PubMed
    1. de Bold A.J. Atrial natriuretic factor: a hormone produced by the heart. Science. 1985;230:767–770. - PubMed

Publication types

Substances