. 2019 Dec;10(1):144-166.
doi: 10.1080/19491034.2019.1629795.

MLKS2 is an ARM domain and F-actin-associated KASH protein that functions in stomatal complex development and meiotic chromosome segregation

Affiliations

MLKS2 is an ARM domain and F-actin-associated KASH protein that functions in stomatal complex development and meiotic chromosome segregation

Hardeep K Gumber et al. Nucleus. 2019 Dec.

Abstract

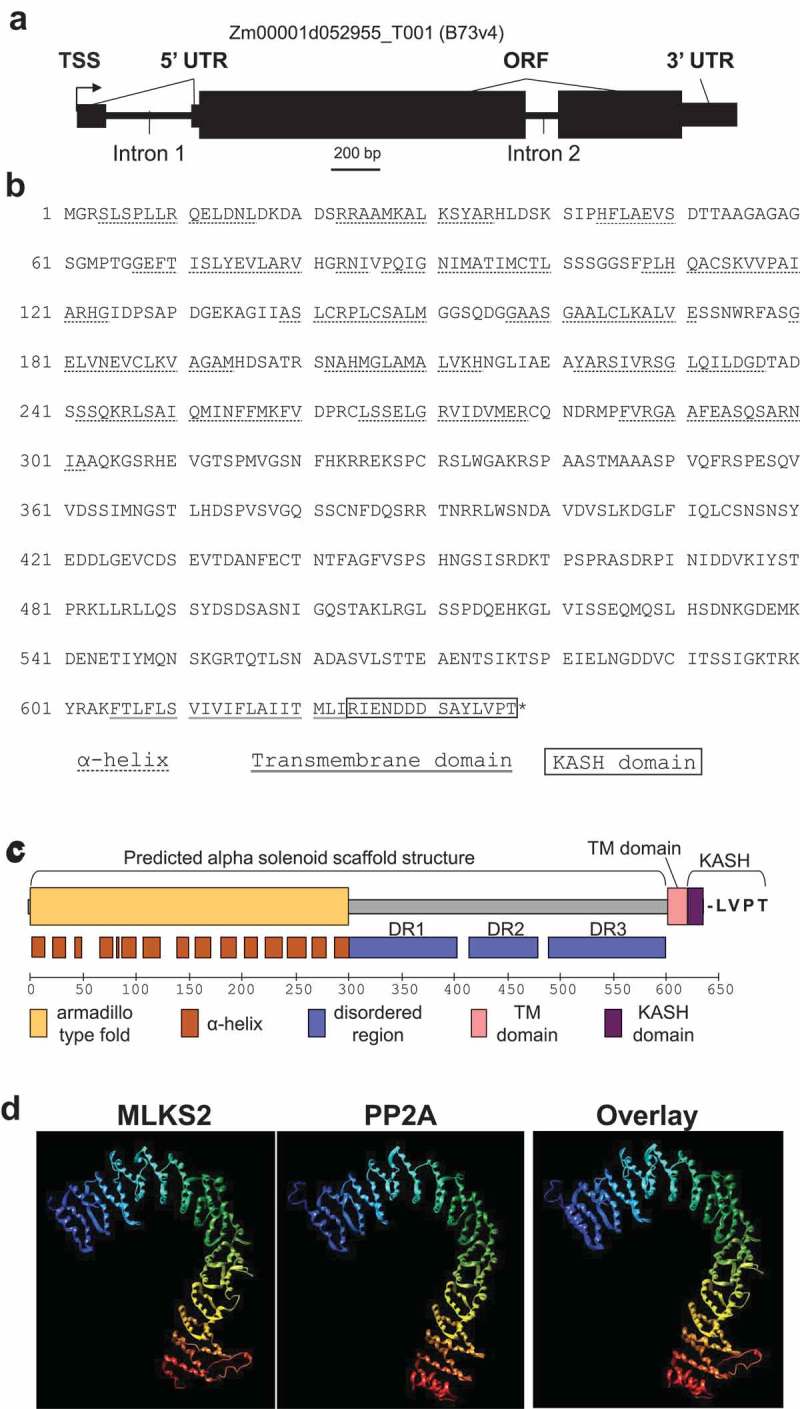
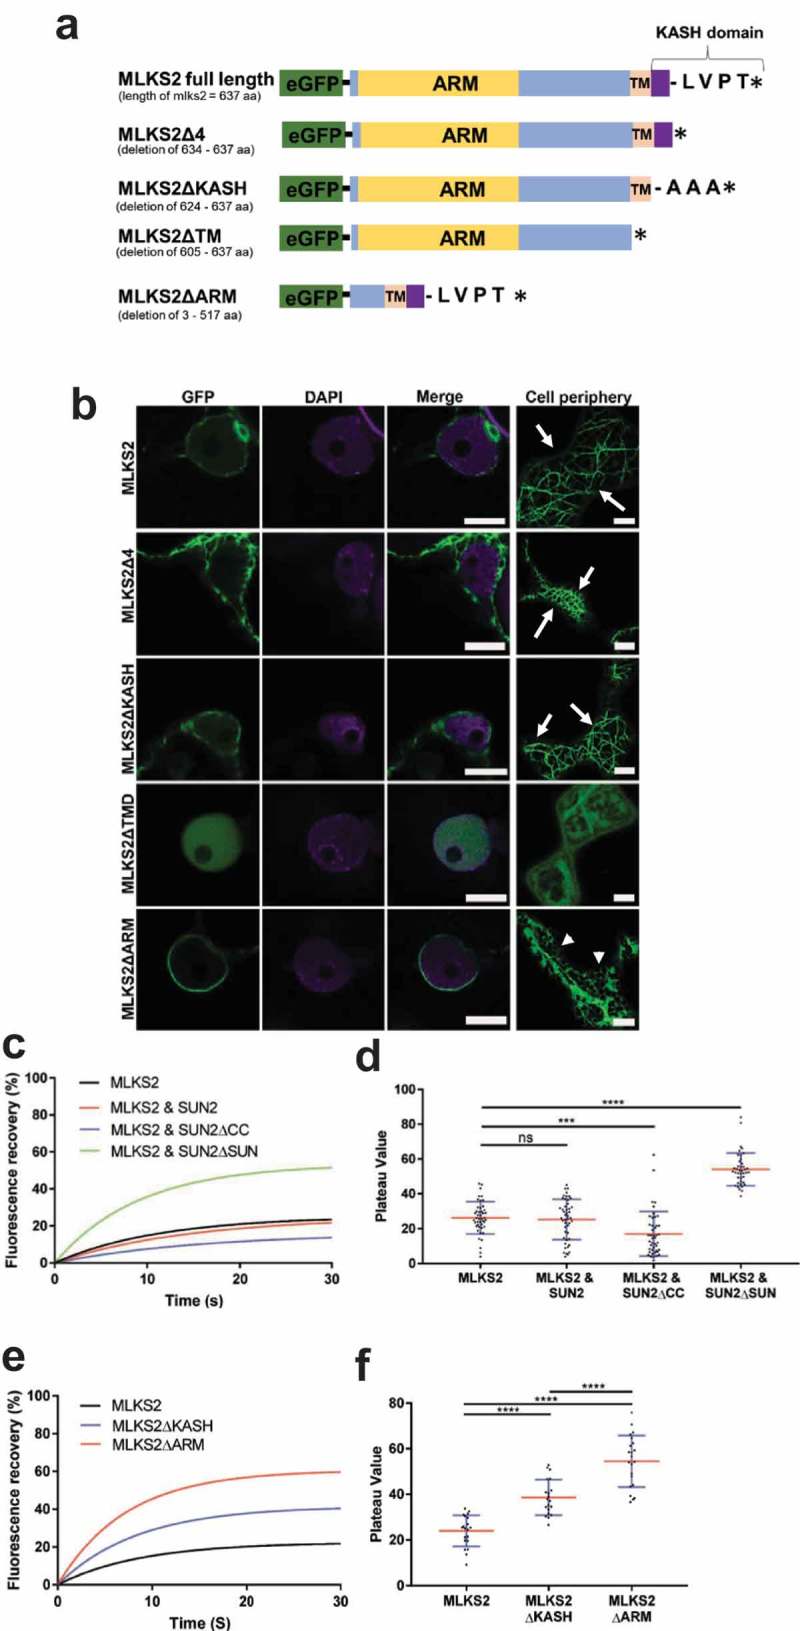
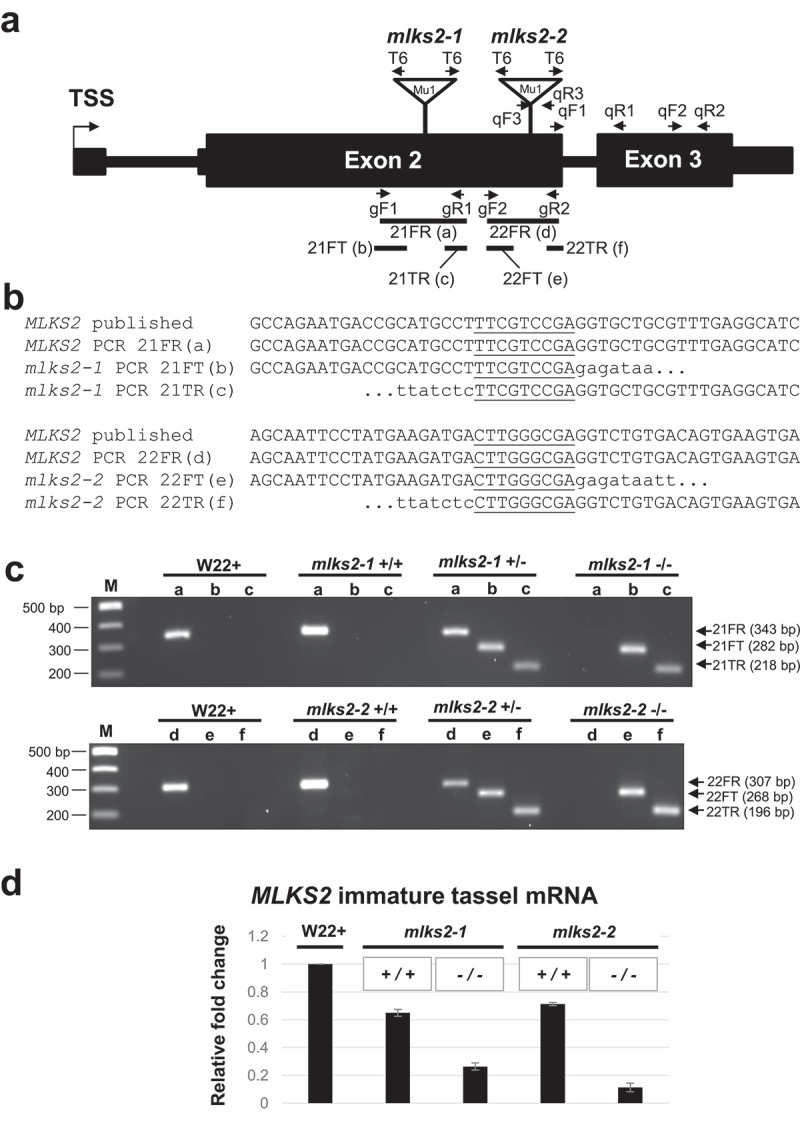
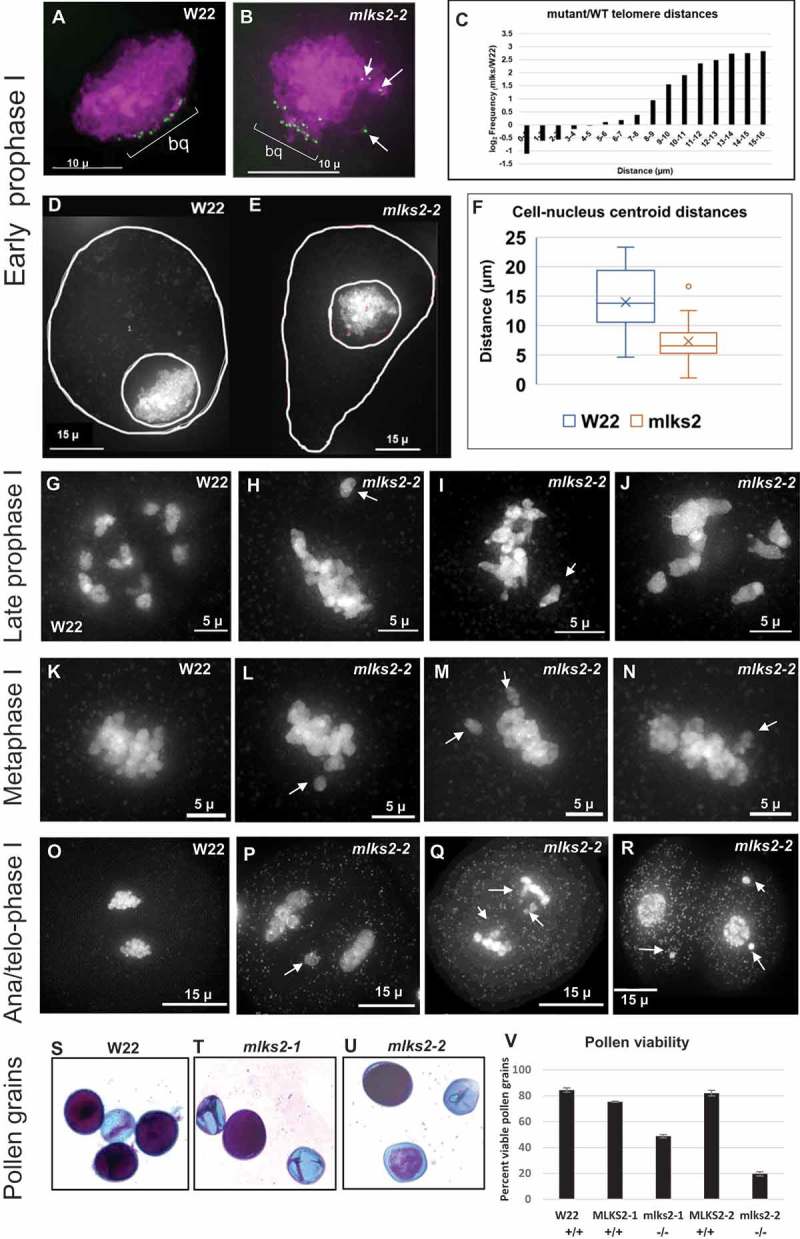
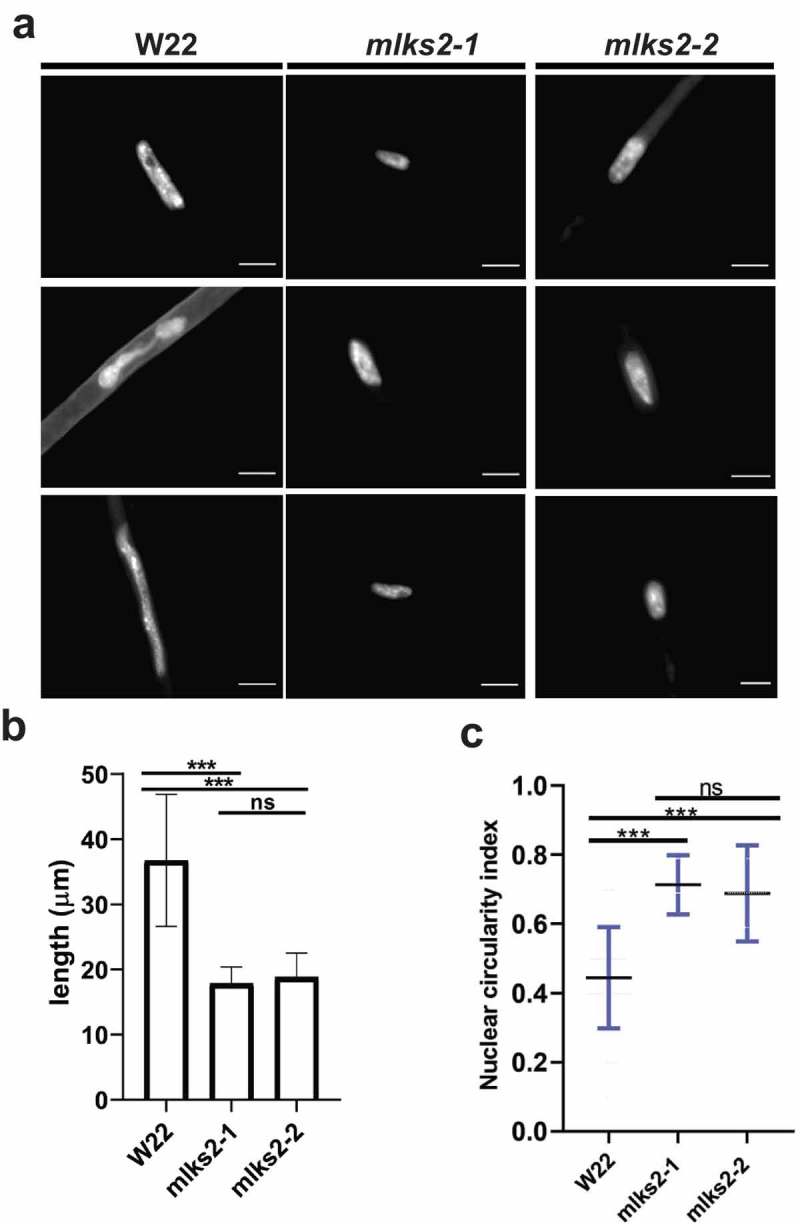
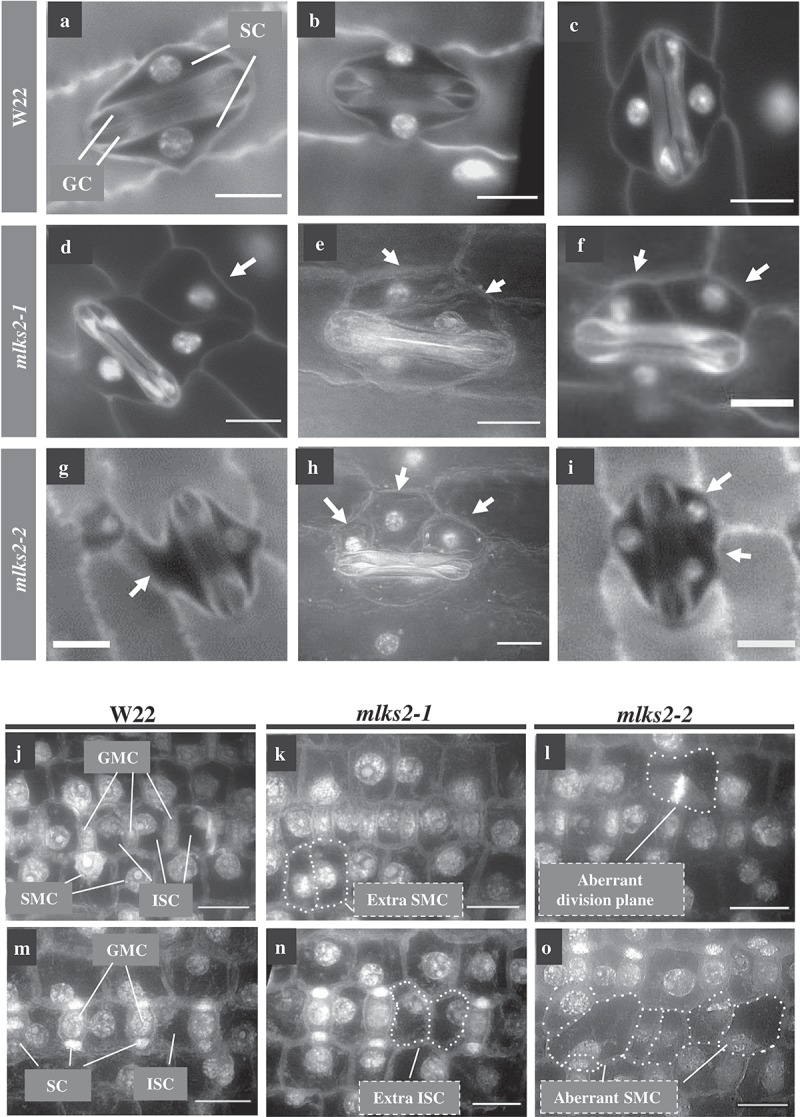
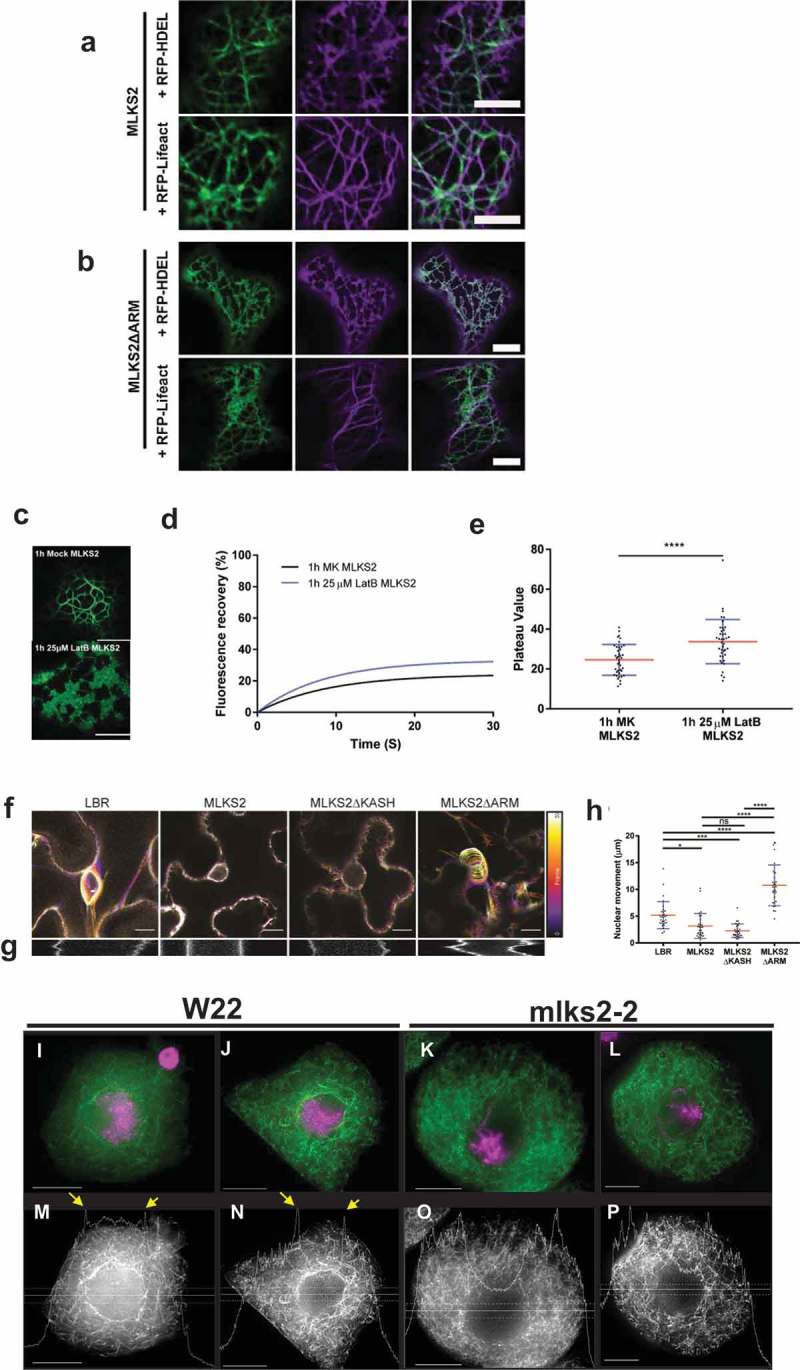
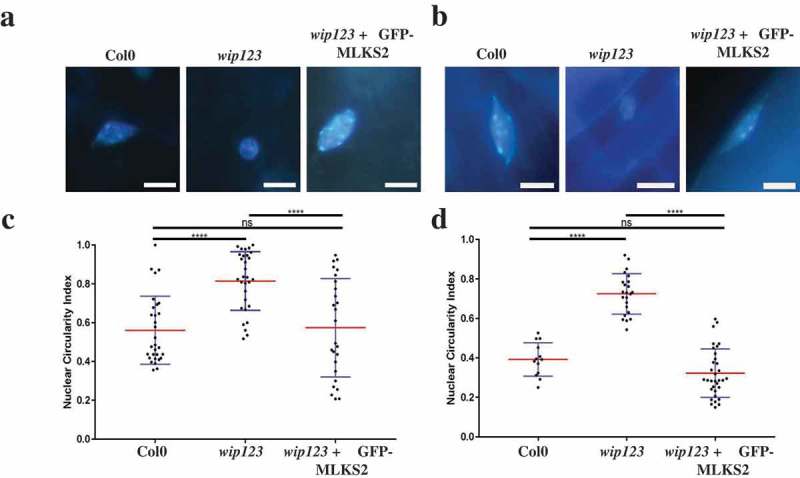
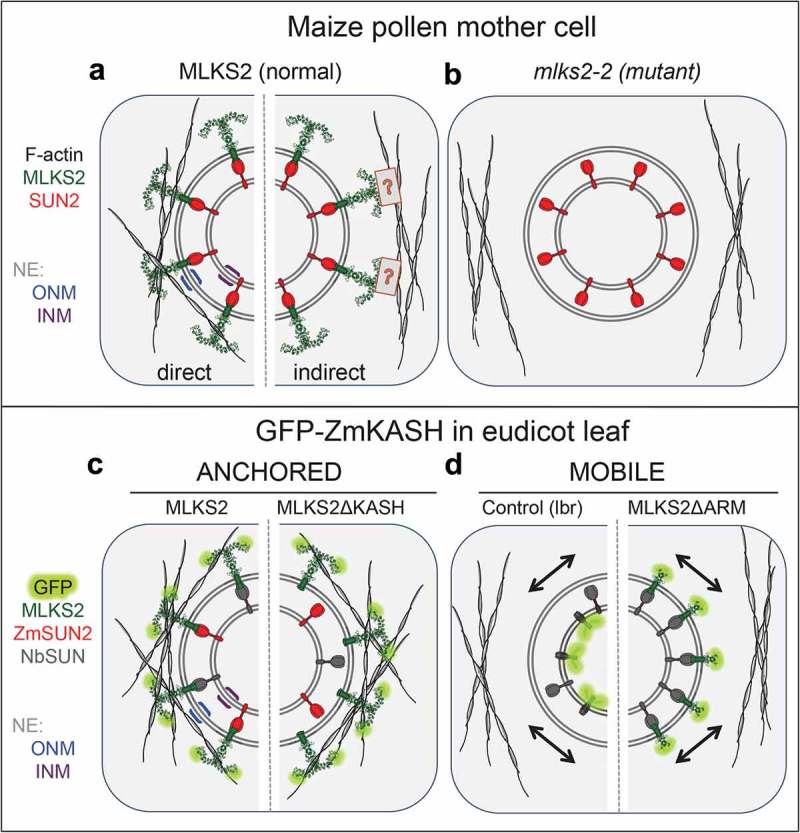
The linker of nucleoskeleton and cytoskeleton (LINC) complex is an essential multi-protein structure spanning the eukaryotic nuclear envelope. The LINC complex functions to maintain nuclear architecture, positioning, and mobility, along with specialized functions in meiotic prophase and chromosome segregation. Members of the LINC complex were recently identified in maize, an important scientific and agricultural grass species. Here we characterized Maize LINC KASH AtSINE-like2, MLKS2, which encodes a highly conserved SINE-group plant KASH protein with characteristic N-terminal armadillo repeats (ARM). Using a heterologous expression system, we showed that actively expressed GFP-MLKS2 is targeted to the nuclear periphery and colocalizes with F-actin and the endoplasmic reticulum, but not microtubules in the cell cortex. Expression of GFP-MLKS2, but not GFP-MLKS2ΔARM, resulted in nuclear anchoring. Genetic analysis of transposon-insertion mutations, mlks2-1 and mlks2-2, showed that the mutant phenotypes were pleiotropic, affecting root hair nuclear morphology, stomatal complex development, multiple aspects of meiosis, and pollen viability. In male meiosis, the mutants showed defects for bouquet-stage telomere clustering, nuclear repositioning, perinuclear actin accumulation, dispersal of late prophase bivalents, and meiotic chromosome segregation. These findings support a model in which the nucleus is connected to cytoskeletal F-actin through the ARM-domain, predicted alpha solenoid structure of MLKS2. Functional conservation of MLKS2 was demonstrated through genetic rescue of the misshapen nuclear phenotype of an Arabidopsis (triple-WIP) KASH mutant. This study establishes a role for the SINE-type KASH proteins in affecting the dynamic nuclear phenomena required for normal plant growth and fertility. Abbreviations: FRAP: Fluorescence recovery after photobleaching; DPI: Days post infiltration; OD: Optical density; MLKS2: Maize LINC KASH AtSINE-like2; LINC: Linker of nucleoskeleton and cytoskeleton; NE: Nuclear envelope; INM: Inner nuclear membrane; ONM: Outer nuclear membrane.

Keywords: FRAP; KASH; LINC; MLKS2; actin; bouquet; maize; meiosis; nuclear envelope; telomere.


Figures

Figure 1.
Figure 1.
Gene model and protein domain diagram of MLKS2. a) Gene model diagram for MLKS2 with gene features drawn to scale. Total length of the primary transcript (transcript model for B73v4 is indicated above) is 3007 bp. Three exons are shown as black boxes. The 5ʹUTR of the gene is interrupted by ‘Intron 1.’ Gene features are indicated: TSS, transcription start site; UTR, untranslated region; ORF, open reading frame. b) The amino acid sequence of MLKS2 with domains underlined with lines of different styles, or boxed. The protein sequence is identical to that from genotype W22 (not shown) used for transposon mutagenesis. The key is given under the sequence. c) Domain diagram for MLKS2 showing the names and locations of secondary structural features (alpha helices) or domains are indicated. The conserved terminal four amino residues (LVPT) at the end of the KASH domain are shown . d) The I-TASSER protein structure prediction software was used with MLKS2 as input sequence. The top-ranked structural homolog is shown for a predicted tertiary structure of MLKS2 (1st panel) next to the known structure of PP2A structural subunit (pdb 1b3uA, 2nd panel), followed by an overlay of the two (3rd panel). The rainbow annotation denotes the protein polarity from the N-terminus (blue) to the C-terminus (red). The transmembrane (TMD) and KASH domains of MLKS2 are annotated.
Figure 2.
Figure 2.
MLKS2 cellular localization and ZmSUN2-interaction. Subcellular localization of full length and deletion mutants of GFP-MLKS2 in transiently expressing N. benthamiana leaf cells as previously described [35]. a) Domain deletion diagram of all constructs used showing the ARM domain (yellow), disordered regions (blue), transmembrane domain (TM), KASH domain (purple), terminal AA residues, and stop codon (*). b) Full length GFP-MLKS2 (green) and all but one deletion mutant localize to the NE around DAPI-stained chromatin (magenta). GFP-MLKS2ΔTM appears soluble and distributed throughout the nucleoplasm. A cell periphery network-like pattern was observed for all constructs, with GFP-MLKS2ΔTM appearing as soluble in the cytoplasm and GFP-MLKS2ΔARM appearing as associated with the ER. c) Fluorescence recovery curve from MLKS2 FRAP alone or when co-expressed with mCherry-ZmSUN2, mCherry-ZmSUN2ΔCC (without coiled coil domain), or mCherry-ZmSUN2ΔSUN (without SUN domain). d) FRAP recovery plateau values for fluorescence recovery curves shown in c). e) Fluorescence recovery curves showing increased mobile fraction in the NE for KASH or ARM domain deletion variants of GFP-MLKS2. f) FRAP recovery plateau values of MLKS2, MLKS2ΔKASH, and MLKS2ΔARM shown in d). Scale bar denotes 10 µm. For whisker plots, blue lines denote SD error bars, red lines denote mean. Nuclei (N = ≥30) imaged across three experimental repeats per treatment. ANOVA statistical test used where Ns = P ≥ 0.05, *** = P ≤ 0.001 and **** = P ≤ 0.0001.
Figure 3.
Figure 3.
Genotypic characterization of MLKS2 alleles. Two transposon-tagged alleles of MLKS2, mlks2-1 and mlks2-2 are depicted. a) MLKS2 gene model showing the location of Mu1 transposon insertion sites (triangles) for two alleles. The positions of allele-specific primer pairs (gF1, gR1 and gF2, gR2) and Tir6 primer (T6) at the Mu1 transposon terminal inverted repeat sequence are marked with arrows. The positions of primer pairs (qF1, qR1; qF2, qR2; or qF3, qR3) used for qRT-PCR are also marked with arrows. The PCR products (21FR, 21FT, 21TR, 22FR, 22FT, and 22TF) used for sequence verification, genotyping, and quantitative RT-PCR are indicated below the gene model. b) Sequences aligned around the insertion site include the published parental sequence [82], the wild-type allele from PCR products (‘a’ and ‘d’) from W22, and the mutator-flanking sequences from PCR products (‘b’,”c”, ‘e’, and ‘f’) using one gene primer and one mutator-specific primer (T6). In both alleles, a 9-bp duplication (underlined) was detected. c) Agarose gels showing PCR products amplified from W22 and plants from families segregating for mlks2-1 (top gel) or mlks2-2 (bottom gel) allele. The PCR products were amplified using gene-specific primer pairs (lanes/PCR products a, d) or primer pairs from one gene-specific primer and one mutator (T6) primer (lanes/PCR products b, c, e, f). Plant genotypes are shown on the top of the gels, primer pairs and band sizes are indicated on the right. The lanes ‘M’ contain 100 bp DNA marker fragments at the lengths indicated. d) Fold change in the transcript levels of MLKS2 in families segregating for mlks2-1 or mlks2-2; homozygous WT siblings (+/+) or homozygous mutant plants (-/-) were quantified relative to W22 using an average of 3 primer pairs (qF1-qR1, qF2-qR2, qF3-qR3) as measured by qRT-PCR.
Figure 4.
Figure 4.
Multiple meiotic and post-meiotic defects of mlks2 mutants. Cytological defects of mlks2-2 during and after male meiosis. a) Early prophase I stage W22 meiocyte nucleus showing a typical bouquet (green dots, ‘bq’) of NE-associated telomeres visualized in the nucleus (DAPI, shown in magenta) using the 3D acrylamide oligo FISH method [78]. b) Partial telomere bouquet in mlks2-2 mutant at meiotic prophase, showing unusually distant telomeres (arrows) relative to the main bouquet (bq) telomere cluster region. c) Histogram showing bouquet-stage telomere pairwise distance distributions plotted as log2 fold change of mutant/wild-type per 1 micron distance bins (n = 6 W22, n = 11 mlks2-2). The mutants show a pronounced increase in the longer telomere-to-telomere distance bins. Nuclear position phenotypes for normal d) or mutant e) cells shown as projections from the middle-most 1/5 of the optical sections through the nuclei stained with DAPI, including traces around the cell and nuclear peripheries to ascertain 2D centroid locations. f) Eccentricity plots showing the distribution of distances of between the pairwise centroids of nuclei and cells for normal (W22) and mutant (mlks2) meiocytes at at the bouquet stage, using the same nuclei as those analyzed in a-c. g) Late prophase I stage W22 meiocyte showing bivalents spread throughout the volume of the nucleus. h-j) Late prophase I stage mlks2-2 meiocytes showing clumping of bivalents. k) W22 meiocyte showing bivalents on a normal meiosis I metaphase plate. l-n) Mutant mlks2-2 meiocytes showing one or more chromosomes (arrows) not located in the meiosis I metaphase plate. O) W22 meiocyte at late anaphase I or early telophase I. p-q) Mutant mlks2-2 late anaphase I or early telophase I showing irregularly positioned ‘laggard’ chromosomes (arrows). r) Mutant mlks2-2 at telophase after meiosis I, before meiosis II, and showing micronuclei (arrows) that are associated with failure of chromosomes or chromosomal fragments to reach the spindle poles. s-u) Pollen viability stains for wild-type s) or mutant t, u) pollen. Dark purple indicates viable pollen, light blue indicates inviable pollen. v) Quantification of pollen viability with n = 1,000 or more for each genotype.
Figure 5.
Figure 5.
MLKS2 is required for the elongated nuclear shape phenotype in root hair cells. a) Root hair nuclei stained with DAPI in W22, mlks2-1 and mlks2-2 maize plants. b) Quantitation of longest dimension of W22, mlks2-1, or mlks2-2 root hair nuclei. c) Circularity index measurements of nuclei from W22, mlks2-1 and mlks2-2 in which 1.0 represents a perfectly round shape.
Figure 6.
Figure 6.
MLKS2 is required for normal stomatal complex development. Mature stomatal complex in DAPI stained leaf from wild-type W22 (a-c), mlks2-1 (d-f) or mlks2-2 (g-i) plants. For comparison, a typical stomatal complex has bilateral symmetry with two elongated central dumbbell-shaped guard cells (GC) flanked by two outer subsidiary cells (SC). In the mlks2-1 d-f) or mlks2-2 g-i) mutants, subsidiary cells appear abnormal (arrows) in their number, shape, or nuclear position relative to the guard cells. j-l) Representative images from early stages of stomatal development where subsidiary mother cells (SMC) are polarizing, with nuclei migrating towards the guard mother cells (GMC). Interstomatal cells (ISC) are annotated for W22. m-o) Representative images of developing stomatal complex after SMC polarization. Boundaries of abnormally shaped cells or cells with abnormal nuclear positioning are marked with dotted lines. Scale bars denote 15 µm.
Figure 7.
Figure 7.
MLKS2 interaction with actin. Co-localization of ER marker (RFP-HDEL, magenta) or actin marker (RFP-LifeAct, magenta) with a) GFP-MLKS2 or b) GFP-MLKS2ΔARM. c) GFP-MLKS2 localization in F-actin-depleted cells (25 uM LatB) phenocopies GFP-MLKS2ΔARM with an ER-like staining pattern. d) Depolymerization of the actin cytoskeleton with LatB results in increased GFP-MLKS2 FRAP recovery compared to mock (MK) controls. e) FRAP Plateau value of MLKS2 mock (MK) and LatB treated as shown in d). For whisker plots, blue lines denote SD error bars, red lines denote mean. Student’s T-test used to test statistical significance. **** = P ≤ 0.0001. Scale bar denotes 10 µm. f) Temporal color-coded projections of randomly selected LBR, MLKS2, MLKS2ΔKASH and MLKS2ΔARM nuclei imaged every 10 seconds over 5 minutes. g) Kymographs of nuclear movement shown in f) for a different nucleus. h) Quantification of total nuclear movement over time, imaged for LBR, MLKS2, MLKS2ΔKASH and MLKS2ΔARM. N = at least 30 nuclei imaged across three experimental repeats per treatment; ANOVA statistical test used. Ns = P ≥ 0.05, * = P ≤ 0.05, *** = P ≤ 0.001 and **** = P ≤ 0.0001. (i-l) DAPI (magenta) and phalloidin (green) stained early prophase maize meiocytes. (m-p) Gray-scale images of phalloidin staining of cells shown in panels i-l. Line trace plots show intensity of phalloidin in the middle of the cell marked by horizontal band, illustrating the spike in perinuclear actin in wild-type but not mutant nuclei. Scale bar denotes 15 µm.
Figure 8.
Figure 8.
Arabidopsis triple wip mutant phenotype rescued with MLKS2. DAPI stained representative images of a) leaf and b) root nuclei from three Arabidopsis genotypes: Arabidopsis thaliana WT (Col0); (Columbia WT strain), wip123 (AtWIP-type KASH triple mutant where wip123 refers to genotype wip1-1, wip2-1, wip3-1) [83], or wip123 plus GFP-MLKS2 (WIP triple mutant transformed with GFP-MLKS2). (c, d) Nuclear circularity index summaries for these same tissues and genotypes are shown below each tissue/genotype combination, where 1 is a perfectly round nucleus and values lower than 1 are a measure of nuclear elongation. Arabidopsis WIP triple mutant nuclei are significantly more rounded (leaf CI = 0.81 ± 0.03; root CI = 0.72 ± 0.02) than WT (leaf CI = 0.56 ± 0.03; root CI = 0.39 ± 0.02) whereas GFP-MLKS2 complemented nuclei are similar to WT (leaf CI = 0.52 ± 0.03, root CI = 0.32 ± 0.02); p > 0.05 = ns, p < 0.0001 = ****.
Figure 9.
Figure 9.
Summary diagrams and models of ZmMLKS2. Summary diagram illustrates how MLKS2 may interact with F-actin to produce the genetic and heterologous expression phenotypes reported in this study. a) MLKS2 is presumed to be arranged with an ARM domain-containing alpha solenoid structure in the cytoplasm, where it interacts with F-actin directly (left half) or indirectly through a hypothetical connector depicted by the boxed question mark (right half). b) The mks2-2 mutant has lost the ability to bind or contribute to the recruitment of F-actin. Not depicted here are data from MLKS2 in vegetative (leaf, root) organs. Results from kymograph analysis of GFP-MLKS2 expressed in N. benthamiana are summarized for experiments that showed c) anchored nuclei in cells expressing full length MLKS2 or MLKS2ΔKASH, or d) mobile nuclei in cells expressing a control NE marker (lbr) or MLKSΔARM. In these diagrams, evidence for interaction with ZmSUN2 co-expression is indicated (red) on the basis of FRAP assays or depicted from presumed interactions with tobacco SUN, NbSUN (grey). In these diagrams (c,d), the MLKS2 interaction with F-actin is depicted as direct for convenience, but the alternative indirect mode (A, right half) of MLKS2 interaction with F-actin remains a formal possibility.

Similar articles

Cited by

References

    1. Van de Vosse DW, Wan Y, Wozniak RW, ET AL. Role of the nuclear envelope in genome organization and gene expression. Wiley Interdiscip Rev Syst Biol Med. 2011;3:147–166. - PMC - PubMed
    1. D’Angelo MA. Nuclear pore complexes as hubs for gene regulation. Nucleus. 2018;9:142–148. - PMC - PubMed
    1. Hetzer MW. The nuclear envelope. Cold Spring Harb Perspect Biol. 2010;2:a000539. - PMC - PubMed
    1. Burke B, Roux KJ. Nuclei take a position: managing nuclear location. Dev Cell. 2009;17:587–597. - PubMed
    1. Luxton GWG, Starr DA. KASHing up with the nucleus: novel functional roles of KASH proteins at the cytoplasmic surface of the nucleus. Curr Opin Cell Biol. 2014;28:69–75. - PMC - PubMed

Publication types