Review
. 2019 Jun 20;20(1):125.
doi: 10.1186/s13059-019-1738-8.

Essential guidelines for computational method benchmarking

Affiliations
Review

Essential guidelines for computational method benchmarking

Lukas M Weber et al. Genome Biol. .

Abstract

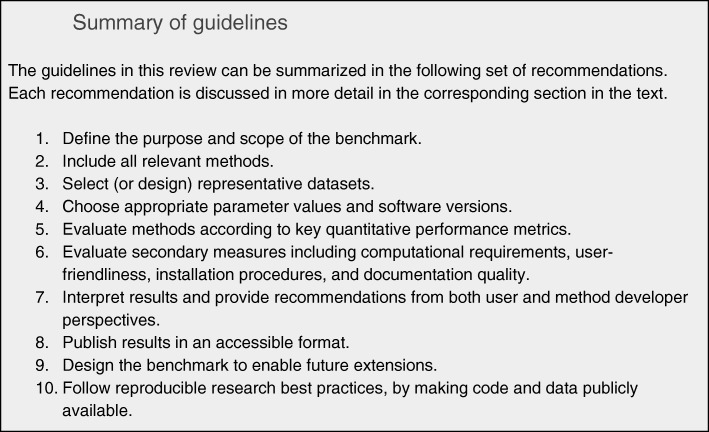
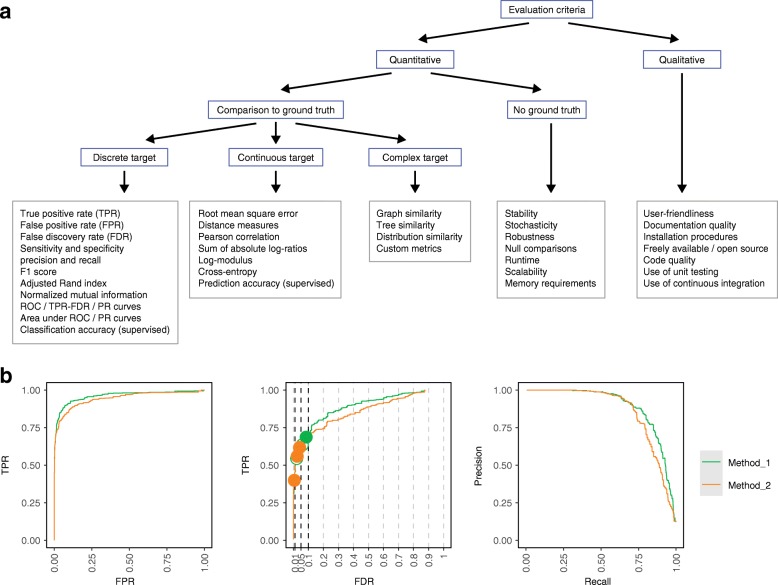
In computational biology and other sciences, researchers are frequently faced with a choice between several computational methods for performing data analyses. Benchmarking studies aim to rigorously compare the performance of different methods using well-characterized benchmark datasets, to determine the strengths of each method or to provide recommendations regarding suitable choices of methods for an analysis. However, benchmarking studies must be carefully designed and implemented to provide accurate, unbiased, and informative results. Here, we summarize key practical guidelines and recommendations for performing high-quality benchmarking analyses, based on our experiences in computational biology.


Conflict of interest statement

The authors declare that they have no competing interests.

Figures

Fig. 1
Fig. 1
Summary of guidelines
Fig. 2
Fig. 2
Summary and examples of performance metrics. a Schematic overview of classes of frequently used performance metrics, including examples (boxes outlined in gray). b Examples of popular visualizations of quantitative performance metrics for classification methods, using reference datasets with a ground truth. ROC curves (left). TPR versus FDR curves (center); circles represent observed TPR and FDR at typical FDR thresholds of 1, 5, and 10%, with filled circles indicating observed FDR lower than or equal to the imposed threshold. PR curves (right). Visualizations in b were generated using iCOBRA R/Bioconductor package [56]. FDR false discovery rate, FPR false positive rate, PR precision–recall, ROC receiver operating characteristic, TPR true positive rate
Fig. 3
Fig. 3
Example of an interactive website allowing users to explore the results of one of our benchmarking studies [27]. This website was created using the Shiny framework in R

References

    1. Zappia L, Phipson B, Oshlack A. Exploring the single-cell RNA-seq analysis landscape with the scRNA-tools database. PLoS Comput Biol. 2018;14:e1006245. doi: 10.1371/journal.pcbi.1006245. - DOI - PMC - PubMed
    1. Boulesteix A-L, Binder H, Abrahamowicz M, Sauerbrei W. On the necessity and design of studies comparing statistical methods. Biom J. 2018;60:216–218. doi: 10.1002/bimj.201700129. - DOI - PubMed
    1. Boulesteix A-L, Lauer S, Eugster MJA. A plea for neutral comparison studies in computational sciences. PLoS One. 2013;8:e61562. doi: 10.1371/journal.pone.0061562. - DOI - PMC - PubMed
    1. Peters B, Brenner SE, Wang E, Slonim D, Kann MG. Putting benchmarks in their rightful place: the heart of computational biology. PLoS Comput Biol. 2018;14:e1006494. doi: 10.1371/journal.pcbi.1006494. - DOI - PMC - PubMed
    1. Boulesteix A-L. Ten simple rules for reducing overoptimistic reporting in methodological computational research. PLoS Comput Biol. 2015;11:e1004191. doi: 10.1371/journal.pcbi.1004191. - DOI - PMC - PubMed

Publication types