Comparative Study
. 2019 Jul;40(7):1140-1148.
doi: 10.3174/ajnr.A6096. Epub 2019 Jun 20.

Brain Tumor-Enhancement Visualization and Morphometric Assessment: A Comparison of MPRAGE, SPACE, and VIBE MRI Techniques

Affiliations
Comparative Study

Brain Tumor-Enhancement Visualization and Morphometric Assessment: A Comparison of MPRAGE, SPACE, and VIBE MRI Techniques

L Danieli et al. AJNR Am J Neuroradiol. 2019 Jul.

Abstract

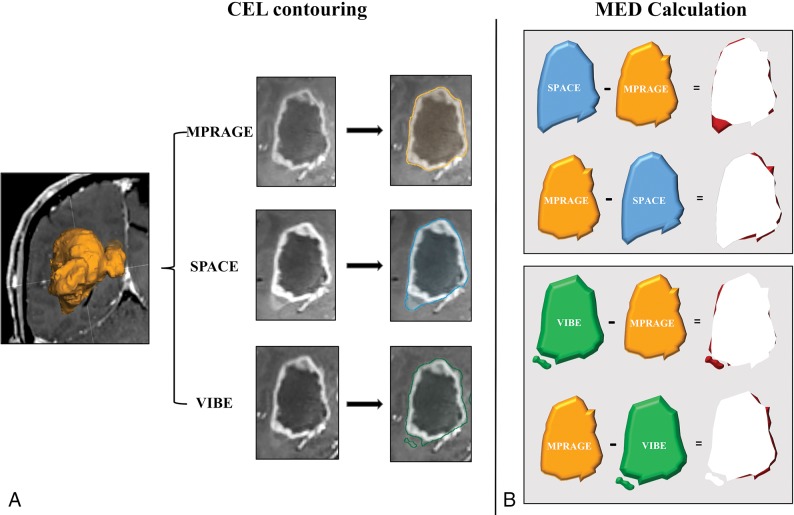
Background and purpose: Postgadolinium MR imaging is crucial for brain tumor diagnosis and morphometric assessment. We compared brain tumor enhancement visualization and the "target" object morphometry obtained with the most commonly used 3D MR imaging technique, MPRAGE, with 2 other routinely available techniques: sampling perfection with application-optimized contrasts by using different flip angle evolutions (SPACE) and volumetric interpolated brain examination (VIBE).

Materials and methods: Fifty-four contrast-enhancing tumors (38 gliomas and 16 metastases) were assessed using MPRAGE, VIBE, and SPACE techniques randomly acquired after gadolinium-based contrast agent administration on a 3T scanner. Enhancement conspicuity was assessed quantitatively by calculating the contrast rate and contrast-to-noise ratio, and qualitatively, by consensus visual comparative ratings. The total enhancing tumor volume and between-sequence discrepancy in the margin delineation were assessed on the corresponding 3D target objects contoured with a computer-assisted software for neuronavigation. The Wilcoxon signed rank and Pearson χ2 nonparametric tests were used to investigate between-sequence discrepancies in the contrast rate, contrast-to-noise ratio, visual conspicuity ratings, tumor volume, and margin delineation estimates. Differences were also tested for 1D (Response Evaluation Criteria in Solid Tumors) and 2D (Response Assessment in Neuro-Oncology) measurements.

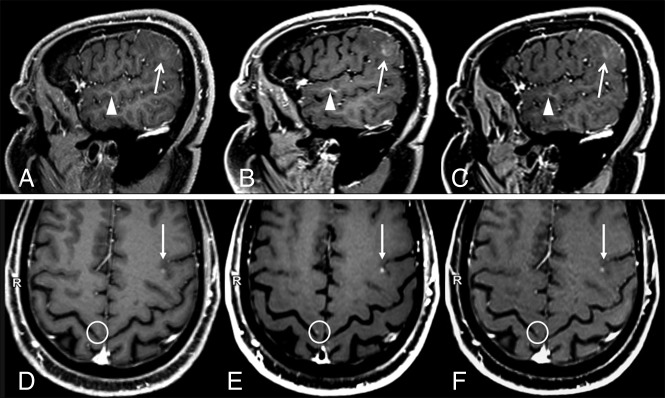
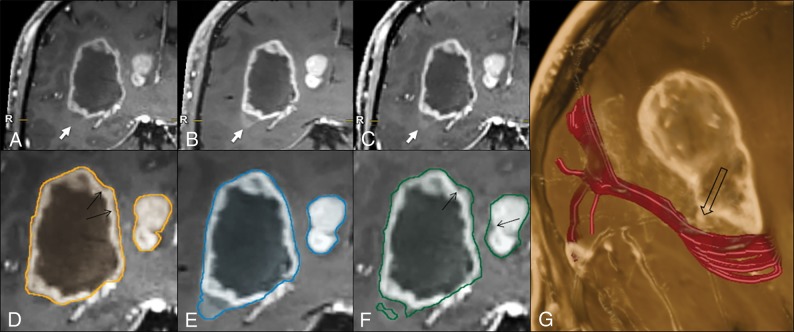
Results: Compared with MPRAGE, both SPACE and VIBE obtained higher contrast rate, contrast-to-noise ratio, and visual conspicuity ratings in both gliomas and metastases (P range, <.001-.001). The between-sequence 3D target object margin discrepancy ranged between 3% and 19.9% of lesion tumor volume. Larger tumor volumes, 1D and 2D measurements were obtained with SPACE (P range, <.01-.007).

Conclusions: Superior conspicuity for brain tumor enhancement can be achieved using SPACE and VIBE techniques, compared with MPRAGE. Discrepancies were also detected when assessing target object size and morphology, with SPACE providing more accurate estimates.


Figures

Fig 1.
Fig 1.
Diagram showing the contrast-enhancing lesion margin extent discrepancy (MED) estimation procedure. This approach is aimed at highlighting the spatial mismatch of the tumor border segmentation obtained from MPRAGE, with respect to SPACE and VIBE, and vice versa. A, First, for each CEL and sequence type, volume segmentation is performed using a validated computer-assisted tool dedicated to pretreatment planning and neuronavigation (SmartBrush 2.5; Brainlab). Segmentations obtained on MPRAGE, SPACE, and VIBE images are, respectively, represented in orange, blue, and green. B, The segmented volumes are reciprocally subtracted, generating maps of the areas where SPACE and VIBE volumes, respectively, exceed MPRAGE, and vice versa. Finally, the resulting MED areas are represented in red.
Fig 2.
Fig 2.
Two sample cases showing differences in contrast-enhancing lesion conspicuity between sequences. A and D, MPRAGE. B and E, SPACE. C and F, VIBE. A–C, Case 1: a patient with a faintly enhancing glioblastoma. Compared with MPRAGE (A), the lesion enhancement (arrows) and its boundary demarcations are much better appreciated on SPACE and VIBE images. The corresponding contrast rate/contrast-to-noise ratio values are 24.75/2.45, 51.32/8.96, and 41.23/6.25, and the rankings are worst, best, and intermediate, respectively, for MPRAGE, SPACE, and VIBE. Also incidentally noted is a developmental venous anomaly (arrowheads), which shows a strong contrast enhancement on black-blood SPACE images. This is probably related to the extremely slow flow seen in such small venous malformations. Images were acquired at 5 minutes after contrast injection in the following order: VIBE, SPACE, MPRAGE. D–F, Case 2: a patient with metastases from renal carcinoma (D, MPRAGE. E, SPACE. F, VIBE). A small CEL is seen in the left frontal lobe (arrows) whose conspicuity with respect to the background parenchyma was ranked worst on MPRAGE, intermediate on VIBE, and best on SPACE images. The corresponding contrast rate/contrast-to-noise ratio values are 8.85/3.08, 18.96/9.15, and 16.63/6.89, respectively. An example of a very tiny metastasis in the right precentral gyrus cortex, which was missed when inspecting MPRAGE images alone but was visible on SPACE and VIBE, is highlighted by circles. This lesion was not included in the analyses. Images were acquired after 5 minutes from contrast injection in the following order: SPACE, VIBE, and MPRAGE.
Fig 3.
Fig 3.
Illustrative case comparing the 3D target-object-creation results in a glioblastoma, obtained on MPRAGE, SPACE, or VIBE images (see the text and Fig 1 for method explanation). There is a clear difference among the MPRAGE (A), SPACE (B), and VIBE (C) conspicuities at the level of the faintly enhancing inferolateral border of the lesion (arrows), which is better represented on the SPACE and VIBE images, compared with MPRAGE. This part of the tumor is not included in the MPRAGE lesion segmentation (D); however, it is captured completely on SPACE (E) and partially on VIBE (F) images. The tractographic reconstruction of the optic radiation trajectory (G, in red) demonstrates the close proximity of the tumor to this tract (empty arrow). The black arrows in D and F indicate some thin areas of tumor margin overestimation on MPRAGE and VIBE, respectively, which are not seen on SPACE images. Images were acquired after 5 minutes from contrast injection in the following order: MPRAGE, VIBE, and SPACE.

References

    1. Gadian DG, Payne JA, Bryant DJ, et al. Gadolinium-DTPA as a contrast agent in MR imaging–theoretical projections and practical observations. J Comput Assist Tomogr 1985;9:242–51 10.1097/00004728-198503000-00003 - DOI - PubMed
    1. Healy ME, Hesselink JR, Press GA, et al. Increased detection of intracranial metastases with intravenous Gd-DTPA. Radiology 1987;165:619–24 10.1148/radiology.165.3.3317496 - DOI - PubMed
    1. Sze G, Milano E, Johnson C, et al. Detection of brain metastases: comparison of contrast-enhanced MR with unenhanced MR and enhanced CT. AJNR Am J Neuroradiol 1990;11:785–91 - PMC - PubMed
    1. Zhao F, Li M, Kong L, et al. Delineation of radiation therapy target volumes for patients with postoperative glioblastoma: a review. Onco Targets Ther 2016;9:3197–204 10.2147/OTT.S104241 - DOI - PMC - PubMed
    1. Cao Y, Tseng CL, Balter JM, et al. MR-guided radiation therapy: transformative technology and its role in the central nervous system. Neuro Oncol 2017;19:ii16–29 10.1093/neuonc/nox006 - DOI - PMC - PubMed

Publication types