. 2019 Jul 9;116(28):14002-14010.
doi: 10.1073/pnas.1817255116. Epub 2019 Jun 20.

A cell topography-based mechanism for ligand discrimination by the T cell receptor

Affiliations

A cell topography-based mechanism for ligand discrimination by the T cell receptor

Ricardo A Fernandes et al. Proc Natl Acad Sci U S A. .

Abstract

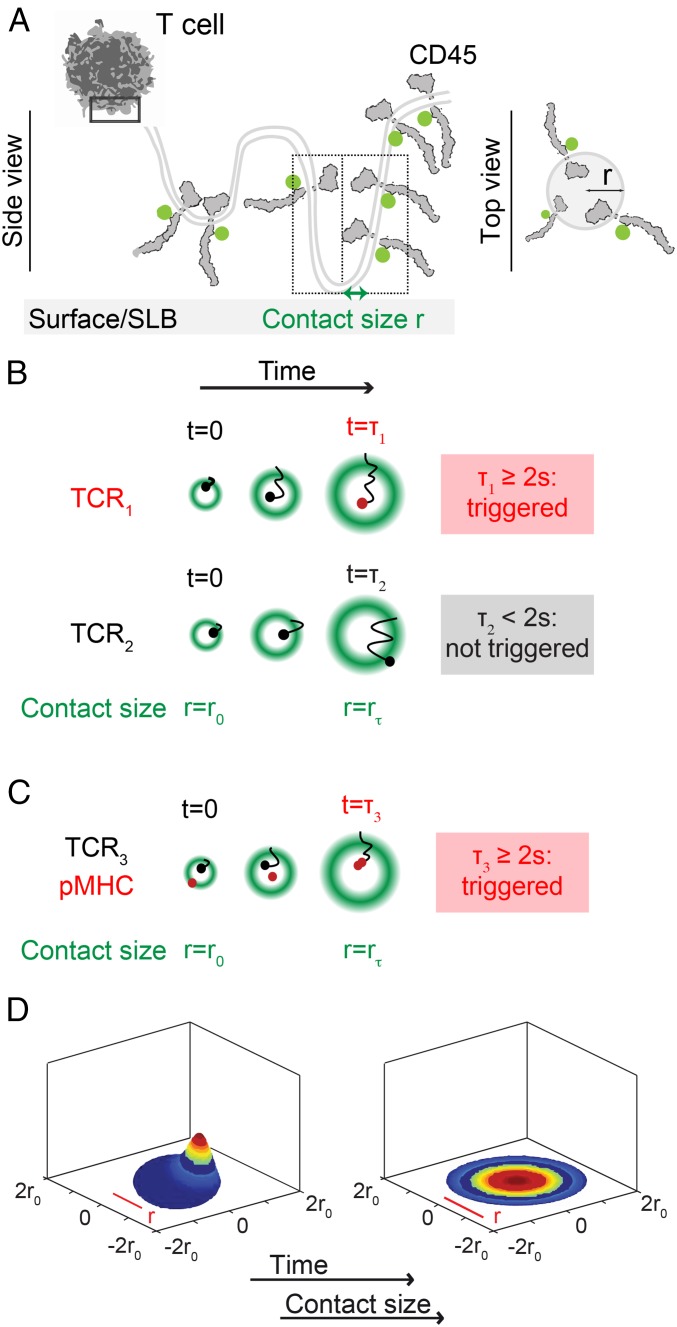
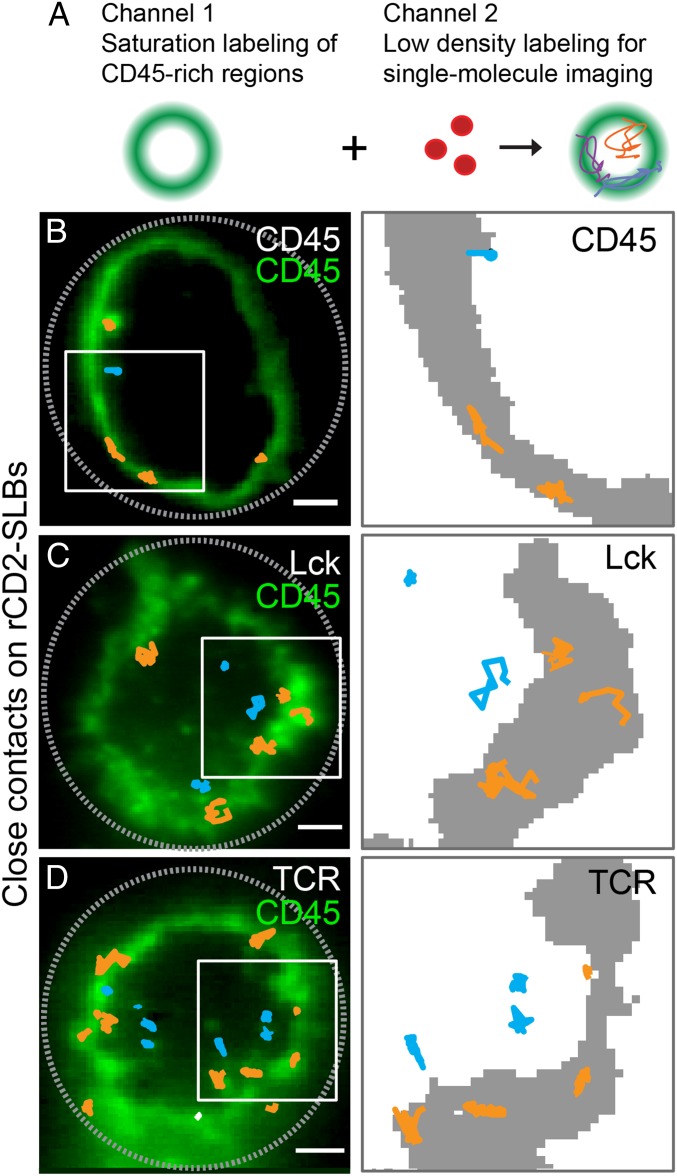
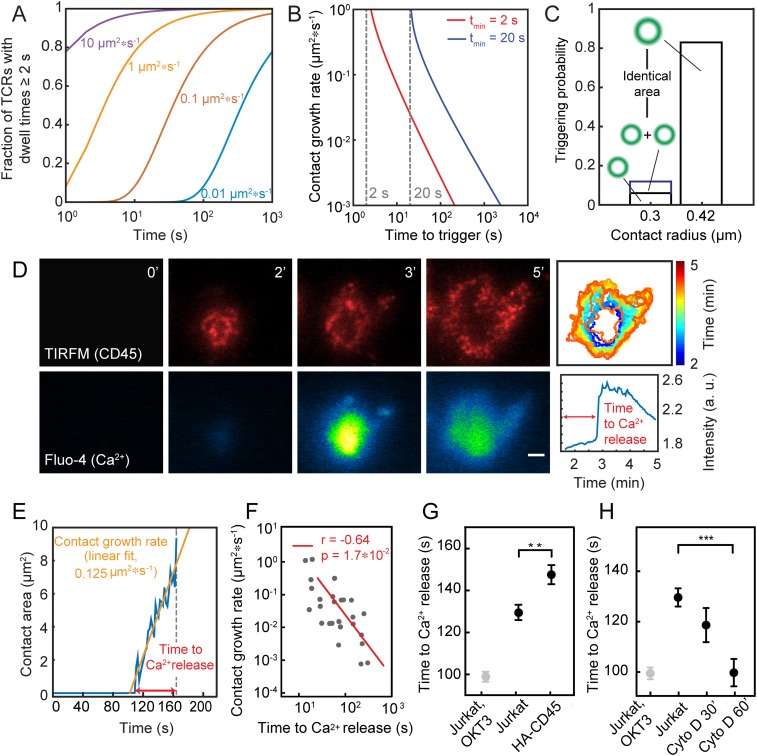
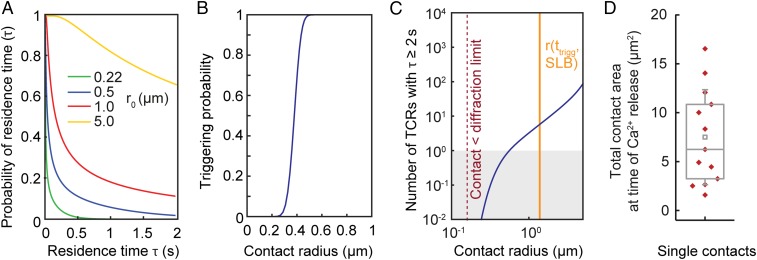
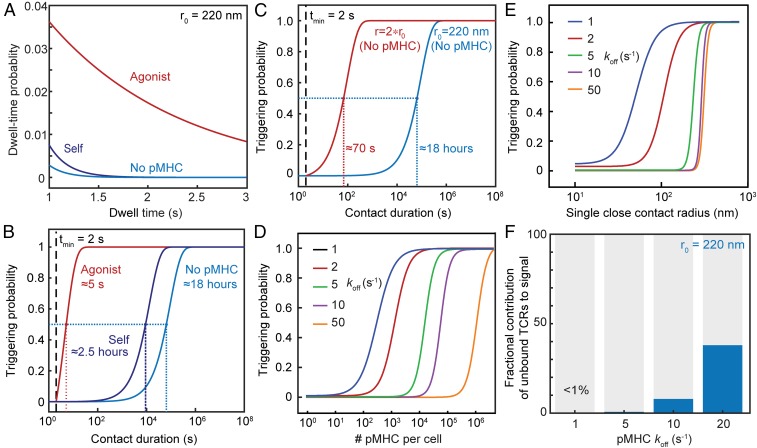
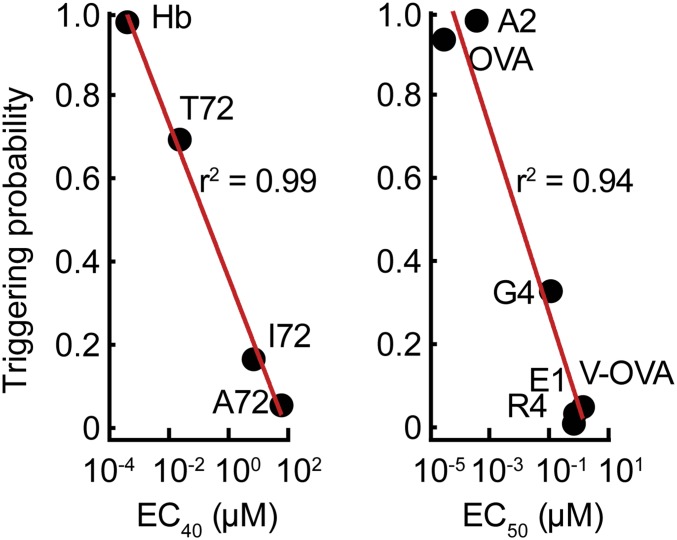
The T cell receptor (TCR) initiates the elimination of pathogens and tumors by T cells. To avoid damage to the host, the receptor must be capable of discriminating between wild-type and mutated self and nonself peptide ligands presented by host cells. Exactly how the TCR does this is unknown. In resting T cells, the TCR is largely unphosphorylated due to the dominance of phosphatases over the kinases expressed at the cell surface. However, when agonist peptides are presented to the TCR by major histocompatibility complex proteins expressed by antigen-presenting cells (APCs), very fast receptor triggering, i.e., TCR phosphorylation, occurs. Recent work suggests that this depends on the local exclusion of the phosphatases from regions of contact of the T cells with the APCs. Here, we developed and tested a quantitative treatment of receptor triggering reliant only on TCR dwell time in phosphatase-depleted cell contacts constrained in area by cell topography. Using the model and experimentally derived parameters, we found that ligand discrimination likely depends crucially on individual contacts being ∼200 nm in radius, matching the dimensions of the surface protrusions used by T cells to interrogate their targets. The model not only correctly predicted the relative signaling potencies of known agonists and nonagonists but also achieved this in the absence of kinetic proofreading. Our work provides a simple, quantitative, and predictive molecular framework for understanding why TCR triggering is so selective and fast and reveals that, for some receptors, cell topography likely influences signaling outcomes.

Keywords: T cell receptor; dwell time; microvilli; receptor triggering; single-molecule imaging.


Conflict of interest statement

The authors declare no conflict of interest.

Figures

Fig. 1.
Fig. 1.
A quantitative treatment of TCR triggering relying on receptor dwell time at phosphatase-depleted close contacts. (A) Top and side views of the close contact depicting contact topography (with contact radius “r”) and CD45 exclusion. The first box (solid line) shows the region of the cell magnified below it. The second box (dotted line) shows the region depicted in the top view on the right. (B) According to the model, a TCR (TCR1) is triggered, i.e., phosphorylated because its residence time in the contact is ≥2 s. TCR2 is not triggered because it diffuses out of the contact in less than 2 s. (C) Also according to the model, a receptor (TCR3) that engages ligand is likely to be held in the contact ≥2 s and become triggered. In B and C, the margins of the contact are marked by the average positions of excluded CD45 molecules (green). (D) Snap shots from the simulation of the TCR density probability evolution in close contacts as they grow over time (SI Appendix, Appendix I).
Fig. 2.
Fig. 2.
Parameterization of the model. (A) Experimental approach. High-density labeling of CD45 (Gap 8.3 Fab, Alexa Fluor 488) was used to indicate sites of close-contact formation between T cells and a rat CD2-presenting SLB (Left), and this was combined with simultaneous low-density labeling of CD45 (Gap 8.3 Fab, Alexa Fluor 568), Lck (Halo tag, tetramethylrhodamine [TMR]), or TCR (Halo tag, TMR) (Right) to enable TIRFM-based single-molecule tracking. (BD, Left) TIRFM-based single-molecule tracking of CD45 (B), Lck (C), and TCR (D). Well-separated individual trajectories were recorded for >280 ms and colored according to position in the contact (orange in CD45-rich regions and blue in CD45-depleted regions). (Right) Close-up views of trajectories in regions marked by white rectangles; CD45-rich regions are shown in gray. (Scale bar, 2 µm.) Data are representative of three independent experiments with n > 10 cells.
Fig. 3.
Fig. 3.
Experimental validation of the model. (A) Fraction of triggered TCRs as a function of time and contact growth rate (tmin = 2 s, D = 0.05 µm2/s, g = 0.01 to 10 µm2/s). (B) Time taken to TCR triggering as a function of close-contact growth rate. (C) Comparison of triggering probability for one versus two contacts or a single contact of double the contact area. (D) Dynamics of close-contact formation [CD45 fluorescence (Gap 8.3 Fab, Alexa Fluor 568), TIRFM] (Top) and Ca2+ release (detected as Fluo-4 fluorescence) (Bottom) for cells contacting rCD2-presenting SLBs. (Scale bar, 2 μm.) (Top Right) Color-coded representation of the temporal evolution of contact area over time. (Bottom Right) Temporal evolution of Fluo-4 intensity averaged over entire contact; n > 10 cells from five independent experiments. (E) Trace of a representative contact over time for growth-rate determination. (F) Relationship between close-contact growth rate and the time taken to triggering. (G) Time delay between initial contact of cells with rCD2-presenting SLBs and Ca2+ release for Jurkat T cells and cells expressing HA-CD45. (H) Time delay between initial contact of cells with IgG-coated glass and Ca2+ release in the presence of the actin depolymerizing drug cytochalasin D (data shown as mean time of calcium release for three independent experiments with >200 cells per condition; **P = 0.01 and ***P <0.001, two-tailed t test, unequal variance assumed; errors are SEM).
Fig. 4.
Fig. 4.
Why the TCR can be triggered in the absence of ligands. (A) Probability that a TCR remains inside a close contact for time, τ, for close contacts of varying fixed radius, r0. (B) Probability that a single TCR stays inside a close contact >2 s as a function of final close-contact radius for growing contacts. (C) Total number of TCRs that remain inside the close contact for >2 s, incorporating the estimates shown in A, the density of TCRs in Jurkat T cells, and the degree of exclusion of the TCR from close contacts for cells interacting with rCD2-presenting SLBs. (D) Total contact area (region of CD45 exclusion) at the time of calcium release for T cells interacting with rCD2-presenting SLBs (13 cells, 5 independent experiments). Central lines indicate the median; small squares indicate the mean; boxes show interquartile range; whiskers indicate SD.
Fig. 5.
Fig. 5.
Self/nonself discrimination. (A) Probability distribution of close-contact residence times for TCRs in the presence and absence of agonist and self pMHC, for a close contact of radius r0 = 220 nm, showing that discrimination of ligands is not dependent on a threshold value for tmin. (B) Probability that at least one TCR will be triggered, i.e., stay in the contact for tmin ≥ 2 s, as a function of contact duration tf in the presence and absence of agonist pMHC with a low koff (koff = 1 s−1, 30 pMHC/μm2), or a self pMHC with a larger koff present at higher pMHC densities (koff = 50 s−1, 300 pMHC/μm2); r0 = 220 nm. (C) Comparison of the triggering probability in the absence of pMHC for close contacts of 220 and 440 nm. (D) Triggering probability as a function of pMHC densities and pMHC off rates for a single contact of 220 nm radius with a duration of tf = 120 s. (E) Triggering probability as a function of close contact radius for pMHC with varying off rates for a contact duration of tf = 120 s. (F) Contribution to the overall signal of TCRs that are triggered without binding to pMHC, in the presence of agonist pMHC with varying koff (30 pMHC/μm2).
Fig. 6.
Fig. 6.
Prediction of the relative signaling potencies of well-characterized TCR ligands. Peptide-stimulation potencies (EC40 and EC50 values for IL-2 secretion) for CD4+ (Left) and CD8+ T cells (Right) (determined elsewhere in refs. , , and 53), plotted against the probability that at least one TCR triggering event (tmin ≥ 2 s) occurs at a single contact of r0 = 220 nm, that persists for tf = 120 s.

References

    1. Smith-Garvin J. E., Koretzky G. A., Jordan M. S., T cell activation. Annu. Rev. Immunol. 27, 591–619 (2009). - PMC - PubMed
    1. Morris G. P., Allen P. M., How the TCR balances sensitivity and specificity for the recognition of self and pathogens. Nat. Immunol. 13, 121–128 (2012). - PubMed
    1. Wong H. S., Germain R. N., Robust control of the adaptive immune system. Semin. Immunol. 36, 17–27 (2018). - PubMed
    1. Lim W. A., June C. H., The principles of engineering immune cells to treat cancer. Cell 168, 724–740 (2017). - PMC - PubMed
    1. Kershaw M. H., Westwood J. A., Darcy P. K., Gene-engineered T cells for cancer therapy. Nat. Rev. Cancer 13, 525–541 (2013). - PubMed

Publication types

MeSH terms

LinkOut - more resources