. 2019 Jul 19;365(6450):eaav9518.
doi: 10.1126/science.aav9518. Epub 2019 Jun 20.

Amyloid β oligomers constrict human capillaries in Alzheimer's disease via signaling to pericytes

Affiliations

Amyloid β oligomers constrict human capillaries in Alzheimer's disease via signaling to pericytes

Ross Nortley et al. Science. .

Abstract

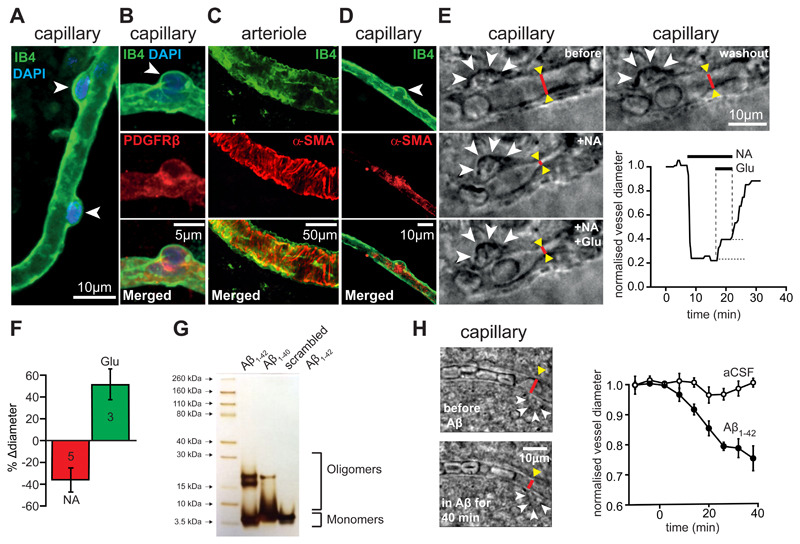
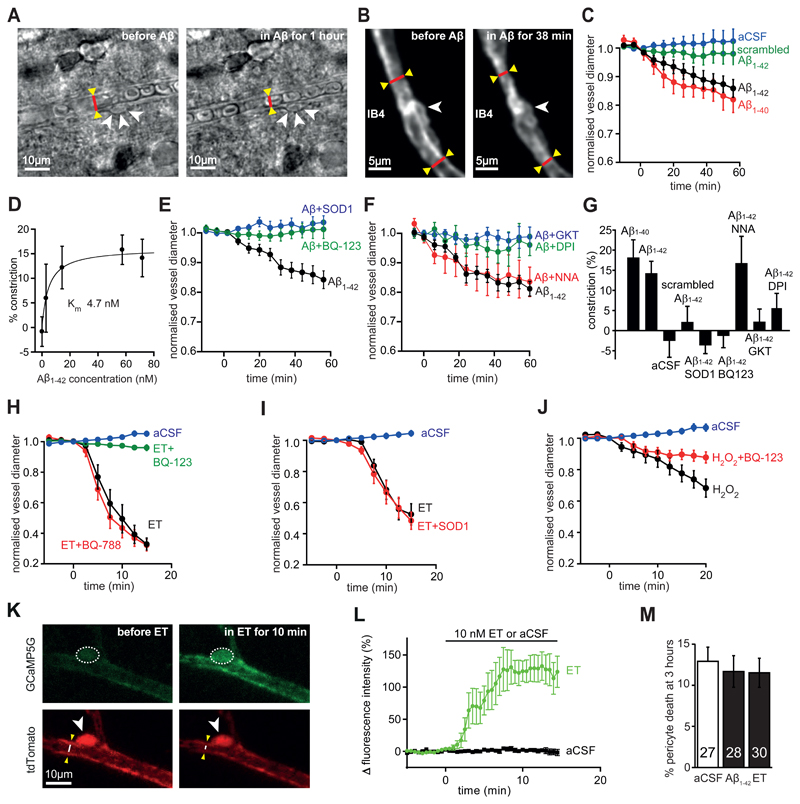
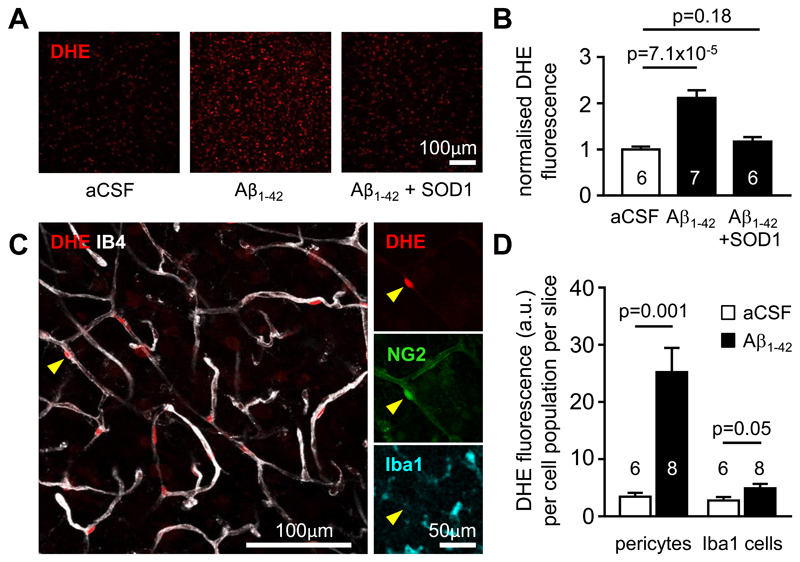
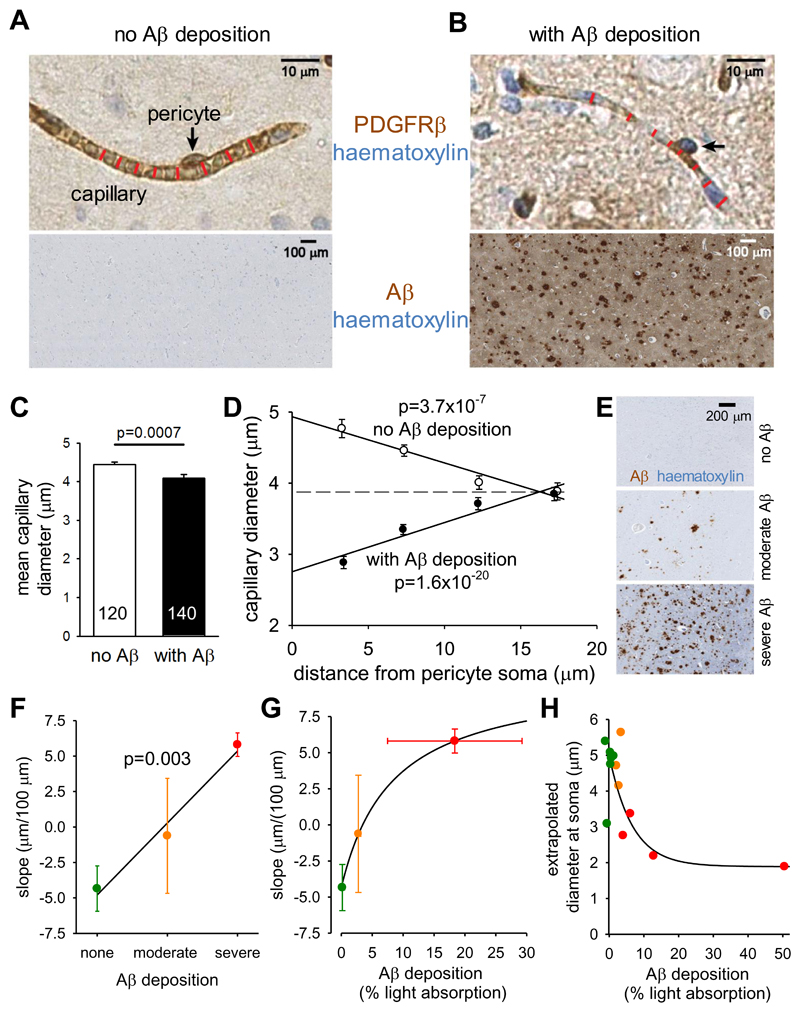
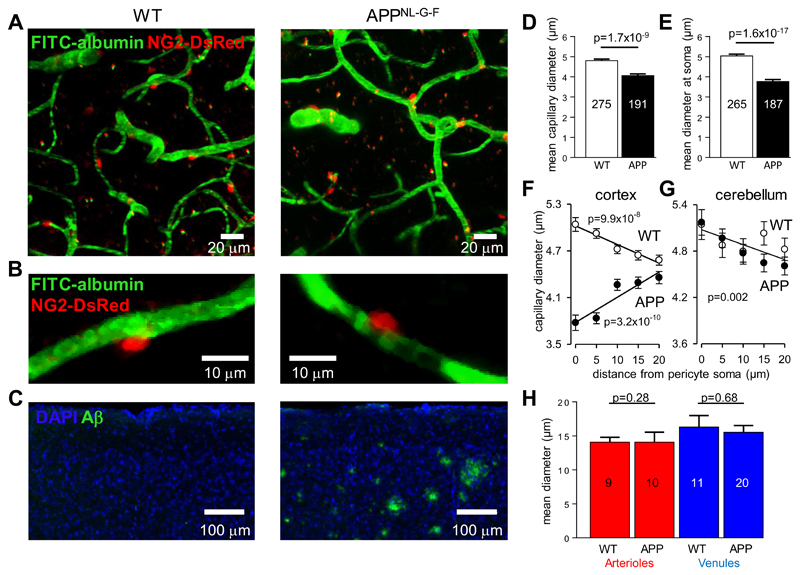
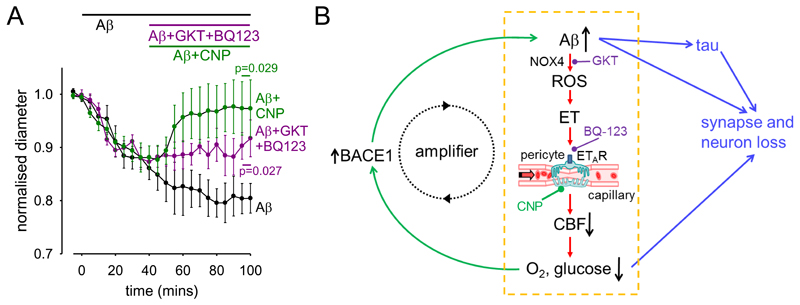
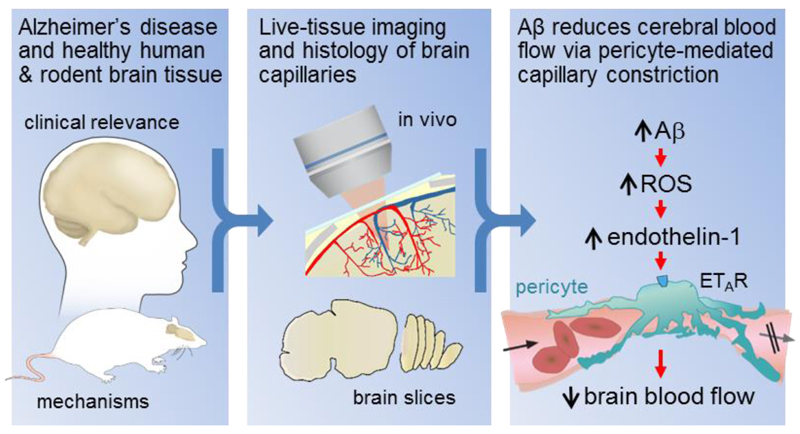
Cerebral blood flow is reduced early in the onset of Alzheimer's disease (AD). Because most of the vascular resistance within the brain is in capillaries, this could reflect dysfunction of contractile pericytes on capillary walls. We used live and rapidly fixed biopsied human tissue to establish disease relevance, and rodent experiments to define mechanism. We found that in humans with cognitive decline, amyloid β (Aβ) constricts brain capillaries at pericyte locations. This was caused by Aβ generating reactive oxygen species, which evoked the release of endothelin-1 (ET) that activated pericyte ETA receptors. Capillary, but not arteriole, constriction also occurred in vivo in a mouse model of AD. Thus, inhibiting the capillary constriction caused by Aβ could potentially reduce energy lack and neurodegeneration in AD.


Conflict of interest statement

Competing interests None.

Figures

Figure 1
Figure 1. Oligomeric Aβ acts on pericytes to constrict capillaries in human brain slices.
(A) Isolectin B4 - labeled capillary in a human cortical slice, with two pericyte somata (arrow heads) outlined by their basement membrane. (B) Pericyte labeled with antibody to PDGFRβ. (C-D) Arteriole (C) and pericyte (D) labeled with isolectin B4 and antibody to α smooth muscle actin (α-SMA, localised in processes originating from the pericyte soma). (E) Images of a capillary (red lines indicate diameter) and pericyte soma (arrowheads) in a live human brain slice before drug application (before), in the presence of 2 μM superfused noradrenaline (+NA), with 2 μM NA and 500 μM glutamate superfused (+NA +Glu), and after stopping drug superfusion (washout). Graph shows time course of capillary diameter at red line throughout the experiment. (F) Mean (±s.e.m) glutamate-evoked dilation and noradrenaline-evoked constriction in experiments as in (E) (number of pericytes on bars; change in diameter was quantified relative to that before application of each drug; relative to the pre-noradrenaline diameter the glutamate-evoked dilation was 26.8±7.7%). (G) Silver staining of an SDS-PAGE gel for Aβ solutions prepared as in the Materials and Methods. (H) Images of a human capillary before and after superfusion of 72 nM Aβ1-42, showing a region (red line) being constricted by a pericyte (arrowheads). Graph shows mean (±s.e.m) diameter change at 4 pericyte locations from 4 slices treated with Aβ and 3 pericyte locations from 3 slices superfused with aCSF lacking Aβ (significantly reduced at 40 mins in Aβ, p=0.01).
Figure 2
Figure 2. Aβ acts via reactive oxygen species and endothelin type A receptors.
(A-B) Bright field images (A) and two-photon evoked IB4 fluorescence (B) of capillaries in rat cortical slices in aCSF and after applying 72 nM Aβ1-42, showing constriction near pericytes (arrowheads, cf. Figs. S2, S3). (C) Mean (±s.e.m) time course of capillary diameter during superfusion with aCSF (n=51 vessels), scrambled Aβ1-42 (109 nM, n=32), Aβ1-42 (72 nM, n=20) or Aβ1-40 (100 nM, n=6). (D) Constriction evoked after 1 hour by different concentrations of Aβ1-42 (n=51, 11, 10, 19 and 20 for 0, 2.9, 14, 57 and 72 nM respectively). Curve is a Michaelis-Menten relation with a Km of 4.7 nM and a maximum of 16.1%. (E-J) Time course of diameter when applying the following agents (experiments on each figure panel were interleaved; blockers were present for 5-15 mins before Aβ). (E) 57 nM Aβ1-42 alone (n=19), or in the presence of superoxide dismutase 1 (SOD1, 150 units/ml, n=19) or the ETA blocker BQ-123 (1 μM, n=14). (F) 72 nM Aβ1-42 alone (n=7), or in the presence of the NOS blocker L-NNA (100 μM, n=6), the NADPH oxidase blocker DPI (10 μM, n=5), or the NOX4 blocker GKT137831 (0.45 μM, n=7). (G) Constriction produced at 60 mins for (C)-(F). (H) Effect of aCSF (n=10), ET alone (10 nM, n=10), or ET in the presence of the ETA blocker BQ-123 (1 μM, n=10) or the ETB blocker BQ-788 (1 μM, n=12). (I) aCSF or ET (5 nM) in the absence (n=12) or presence of SOD1 (150 units/ml, n=8). (J) aCSF or the ROS generator H2O2 (1 mM, n=9, which evokes constriction: p=1.1x10⁻⁵ at 20 mins) or H2O2 with the ETA blocker BQ-123 (1 μM, n=11, constriction is reduced, p=0.009). (K) Two-photon image of mouse cortical pericyte expressing GCaMP5G (green), before and while applying ET (10 nM), which raises [Ca2+]i (increase in green intensity) in pericyte soma (arrowhead, dashed line shows ROI analysed) and processes, and constricts the capillary (see white line on image of the tdTomato reporter of GCaMP5G expression, red). (L) Mean [Ca2+]i time course in 8 pericyte somata in response to ET (significantly elevated, p=0.0014) and in 7 somata in aCSF (no significant change, p=0.74). (M) Incubating rat brain slices (number on bars) with Aβ1-42 oligomers (1.4 μM) or ET (100 nM) for 3 hours does not increase pericyte death.
Figure 3
Figure 3. Aβ evokes ROS generation in pericytes.
(A) Fluorescence images of dihydroethidium (DHE) loaded rat cortical slices incubated in control aCSF or aCSF containing Aβ1-42 (72 nM) or Aβ1-42 + SOD1 (150 units/ml) for 40 min, showing that Aβ increases ROS level, and this is inhibited by SOD1. (B) Fluorescence (normalised to value in aCSF, mean±s.e.m.) of slices incubated in aCSF (n=6), Aβ1-42 (n=7) or Aβ1-42 + SOD1 (n=6). (C) Left: Image of a cortical slice showing that the brightest DHE-labeled cells are located on IB4-labeled blood vessels (arrowhead). Right: Immunolabeling shows that these cells colocalise with NG2, but not Iba1, implying that they are pericytes rather than microglia or perivascular macrophages. (D) Soma DHE fluorescence (arbitrary units (a.u.), mean±s.e.m.) from the population of pericytes, or of Iba1-labeled cells, after 40 mins in the absence or in the presence of Aβ1-42. Numbers on bars are slices (fluorescence was averaged across 3 image stacks for each slice).
Figure 4
Figure 4. Pericyte-mediated capillary constriction occurs in humans with Aβ deposits.
(A-B) Specimen images of human cortical biopsies, labeled for PDGFRβ (brown in top panels) to show pericytes (arrows), from patients lacking (A) or exhibiting (B) Aβ deposits (brown in bottom panels, haematoxylin counterstain blue). Red lines indicate capillary diameter. (C) Mean (±s.e.m) diameter of capillaries in patients lacking (3921 diameters measured) or exhibiting (5121 diameters measured) Aβ deposits (number of images analysed shown on bars). (D) Dependence of capillary diameter on distance from a visible pericyte soma (in 5 μm bins, from 0-5, 5-10, 10-15 and 15-20 μm, plotted at the mean distance for each bin) for patients lacking or exhibiting Aβ deposits (moderate and severe Aβ deposition pooled together). P values assess whether slope of regression line is significantly different from zero. (E) Examples of Aβ labeling assessed by the neuropathologist as absent, moderate or severe. (F) Slope of regression lines as in (D) plotted as a function of neuropathologist-rated parenchymal Aβ load for each biopsy (n=6 biopsies for none, n=3 for moderate, n=4 for severe). P value compares slope of line with zero. (G) Slope of regression lines as in (D) plotted as a function of severity of Aβ deposition measured optically for each biopsy, with subjects grouped by colour (defined in (F)) as classified by neuropathologist. (H) Dependence of extrapolated diameter at soma (as in (D)) on severity of Aβ deposition measured optically for each biopsy, with subject points coloured as classified by neuropathologist (defined in (F)). Lines through data in (F)-(H) show the trends in the data.
Figure 5
Figure 5. Capillaries, but not arterioles or venules, are constricted in AD mice.
(A) Specimen images (taken through the dura) of blood vessels in the somatosensory neocortex of WT and homozygous AD (APPNL-G-F) NG2-DsRed mice, with FITC-albumin (green) in the blood (pericytes are labeled red). (B) Examples of single neocortical capillaries and pericytes, showing a larger diameter at the pericyte soma in a WT mouse and constriction of a capillary at the pericyte soma in an AD mouse. (C) Images of neocortex labeled for nuclei (DAPI, blue) and for amyloid plaques (green, 82E1 antibody). (D) Mean (±s.e.m) capillary diameter in neocortical layers I-IV in 3 WT mice (2131 diameters measured; measurements on same capillary were averaged) and 4 AD mice (1403 diameters measured). Numbers of capillaries are shown on bars. (E) Mean neocortical capillary diameter at pericyte somata in 3 WT and 4 AD mice (number of pericytes on bars).(F) Plot of neocortical capillary diameter as a function of distance from pericyte somata shows a smaller diameter at the soma in AD mice and a larger diameter in WT mice (cf. Fig. 4D; each WT mouse studied showed a negative slope for this relationship, and each AD mouse showed a positive slope). (G) Plots as in (F) but for cerebellum, which lacks amyloid plaques, show no constriction near the pericyte somata in the AD mice (regression line is a fit to all data from 3 WT and 3 APP mice). (H) Mean diameter of neocortical penetrating arterioles and venules in WT and AD mice. Numbers of vessels are shown on bars. Diameters were assessed at depths that did not differ significantly: 158.4±6.7 μm and 131.9±5.0 μm (p=0.23 by Mann-Whitney test) for neocortical capillaries, 142±26 μm and 137±21 μm (p=0.88) for arterioles, and 85±15 μm and 89±9 μm (p=0.81) for venules, in WT and AD mice respectively.
Figure 6
Figure 6. Aβ effects on capillaries may amplify the onset of AD, and are reversible.
(A) Applying GKT137831 (0.45 μM) to block NOX4 and BQ-123 (1 nM) to block ETARs, or C-type natriuretic peptide (CNP, 100 nM, see Fig. S8), significantly reduced the constriction evoked by Aβ (72 nM, p=0.027 and 0.029 respectively, corrected for multiple comparisons, data are presented as mean±s.e.m.). (B) Summary of our results and their implications. Our data reveal the pathway within the yellow dashed box. Amyloid β oligomers activate NADPH oxidase 4 in pericytes to generate reactive oxidative species (ROS). These in turn release, or potentiate the constricting effects of, endothelin-1 which acts via ETA receptors on pericytes on capillaries - the locus (16) of the largest component of vascular resistance within the brain parenchyma. Capillary constriction decreases cerebral blood flow and hence the supply of oxygen and glucose to the brain. Green arrows on the left show that this increases the production of Aβ, in part by upregulating (13, 14) expression of β-amyloid converting enzyme (β-secretase 1, BACE1), thus forming an amplifying positive feedback loop. Blue arrows on the right show that a rise in Aβ concentration, either directly, or via downstream tau production, or via the decrease in oxygen and glucose supply, leads to the loss of synapses and neurons. Potential sites for therapeutic intervention are highlighted at the stages of ROS production by NOX4 (GKT), endothelin receptors (BQ-123) and CNP receptors (see also Fig. S8).
Figure
Figure. Live human and rodent brain capillaries become constricted in Alzheimer’s disease.
Tissue from humans and rodents (left panel) that were healthy or developing Alzheimer’s disease (AD) was imaged in vivo and as brain slices (middle panel), revealing that pericytes constrict brain capillaries early in AD via a mechanism involving ROS generation and release of endothelin-1 which activates ETA receptors (right panel).

Comment in

References

    1. Iturria-Medina Y, Sotero RC, Toussaint PJ, Mateos-Pérez JM, Evans AC. Alzheimer’s Disease Neuroimaging Initiative, Early role of vascular dysregulation on late-onset Alzheimer's disease based on multifactorial data-driven analysis. Nat Comm. 2016;7 11934. - PMC - PubMed
    1. Love S, Miners JS. Cerebrovascular disease in ageing and Alzheimer's disease. Acta Neuropathol. 2016;131:645–658. - PMC - PubMed
    1. Asllani I, Habeck C, Scarmeas N, Borogovac A, Brown TR, Stern Y. Multivariate and univariate analysis of continuous arterial spin labeling perfusion MRI in Alzheimer's disease. J Cereb Blood Flow Metab. 2008;28:725–736. - PMC - PubMed
    1. Kang J, Lemaire HG, Unterbeck A, Salbaum JM, Masters CL, Grzeschik KH, Multhaup G, Beyreuther K, Müller-Hill B. The precursor of Alzheimer’s disease amyloid A4 protein resembles a cell-surface receptor. Nature. 1987;325:733–736. - PubMed
    1. Hardy, Allsop D. Amyloid deposition as the central event in the aetiology of Alzheimer’s disease. Trends Pharmacol Sci. 1991;12:383–388. - PubMed

Publication types

MeSH terms