. 2020 Apr;105(4):1055-1066.
doi: 10.3324/haematol.2019.217927. Epub 2019 Jun 20.

Microhomology-mediated end joining drives complex rearrangements and overexpression of MYC and PVT1 in multiple myeloma

Affiliations

Microhomology-mediated end joining drives complex rearrangements and overexpression of MYC and PVT1 in multiple myeloma

Aneta Mikulasova et al. Haematologica. 2020 Apr.

Abstract

MYC is a widely acting transcription factor and its deregulation is a crucial event in many human cancers. MYC is important biologically and clinically in multiple myeloma, but the mechanisms underlying its dysregulation are poorly understood. We show that MYC rearrangements are present in 36.0% of newly diagnosed myeloma patients, as detected in the largest set of next generation sequencing data to date (n=1,267). Rearrangements were complex and associated with increased expression of MYC and PVT1, but not other genes at 8q24. The highest effect on gene expression was detected in cases where the MYC locus is juxtaposed next to super-enhancers associated with genes such as IGH, IGK, IGL, TXNDC5/BMP6, FAM46C and FOXO3 We identified three hotspots of recombination at 8q24, one of which is enriched for IGH-MYC translocations. Breakpoint analysis indicates primary myeloma rearrangements involving the IGH locus occur through non-homologous end joining, whereas secondary MYC rearrangements occur through microhomology-mediated end joining. This mechanism is different to lymphomas, where non-homologous end joining generates MYC rearrangements. Rearrangements resulted in overexpression of key genes and chromatin immunoprecipitation-sequencing identified that HK2, a member of the glucose metabolism pathway, is directly over-expressed through binding of MYC at its promoter.


Figures

Figure 1.
Figure 1.
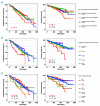
Effect of 8q24 abnormalities on patients’ outcome. (A) 8q24 abnormalities and hyperdiploidy. (B) Translocation complexity. (C) Translocations involving specific types of immunoglobulin locus. *P<0.05; **P<0.01; ***P<0.001. n: number.
Figure 2.
Figure 2.
Circos plots of multiple myeloma samples showing various MYC rearrangements. (A) MYC translocations partners in the dataset of the 1,253 non-complex cases; loci present in 5-9 cases (orange lines) and ≥10 cases (red lines) are highlighted. (B) Complex chromoplexy involving seven chromosomes, including the MYC locus. (C) Simple IGH-MYC t(8;14). (D) t(14;16) with a secondary translocation to MYC. (E) Non-Ig MYC translocation involving TXNDC5/BMP6 on chromosome 6. (F) Non-Ig MYC translocation involving FAM46C on chromosome 1. (G) Inversion on chromosome 8. Annotated genes in uncertain loci were chosen as the closest highly-expressed gene(s) (within 1 Mb maximum distance) defined as being present in >95% of patients with log2 normalized counts >10 in the dataset of 571 cases tested by RNA-sequencing.
Figure 3.
Figure 3.
RNA-sequencing expression analysis of MYC and PVT1 in relation to chromosomal abnormalities at 8q24. Effect of abnormality type (A and D), translocation category (B and E), and translocation breakpoint position (C and F) are shown for MYC and PVT1, respectively. *P<0.05; **P<0.01; ***P<0.001. n: number.
Figure 4.
Figure 4.
Primary IGH rearrangements and MYC rearrangements occur through different mechanisms. (A) The locations of classical IGH (green dots) and IGH-MYC (red dots) translocation breakpoints on 14q32.33. Yellow bars show super enhancers identified in MM.1S cell line. Purple bars show activation-induced cytidine deaminase motif clusters (>200 RGYW motifs per 2.5 kb) indicating switch (S-) regions. IGH constant regions are indicated as red blocks. (B) IGH-MYC breakpoints on 8q24.21 (red dots). Blue bars show the two breakpoint hotspots identified in Figure 5. The location of MYC (red) and other genes (gray) are indicated. (C) Primary IGH translocations, MYC translocations and other translocations were compared for microhomology between chromosomes surrounding the breakpoints. Primary translocations have significantly more blunt-ended rearrangements compared to MYC rearrangements (P<0.001), consistent with microhomology-mediated end joining.
Figure 5.
Figure 5.
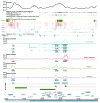
Distribution of chromosomal breakpoints and minimally altered regions detected at the MYC region. Percent values show proportion of breakpoints in the defined hotspot for a specific category of abnormalities. (A) Three breakpoints hotspots. (B) Minimal tandem-duplicated region. (C) Two minimal copy number gained regions (excluding tandem-duplications). (D) Two minimally deleted regions. (E) Minimal copy-number lost region (excluding deletions). Details of copy-number abnormalities analysis are given in Online Supplementary Figures S2 and S3. Upper dotted line shows germinal center (GC) content, ENCODE open chromatin markers identified by a combination of DNase-seq and FAIRE-seq in cell line K562, BLUEPRINT DNase-seq analysis of U266 cell line and BLUEPRINT chromatin immunoprecipitation (ChIP)-sequencing analysis in U266 cell line and four myeloma patients’ samples.
Figure 6.
Figure 6.
Chromosomal breakpoints in MYC translocation partners’ regions. (A) IGH locus at 14q32.33. (B) IGL locus on 22q11.22-22q11.23. (C) IGK locus on 2p11.2. (D) TXNDC5/BMP6 locus on 6p24.3. (E) FAM46C locus on 1p12. (F) FOXO3 locus on 6q21. Yellow bars show super-enhancers identified in the MM.1S cell line; green bars show topologically associated domain (TAD) boundaries identified in RMPI-8226 and U266 cell lines. Ig genes are separated into constant (C, red), joining (J, blue), diversity (D, green) and variable (V, purple) regions; non-Ig highly-expressed genes (present in >95% of patients with log2 normalized counts >10 in the dataset of 571 cases tested by RNA sequencing) are in red and other genes in gray.
Figure 7.
Figure 7.
TAD reorganization through rearrangements places a super-enhancer next to MYC. The TAD architecture (colored triangles) surrounding MYC is indicated in the central panel (red box) as defined in U266 cells. (A) A patient sample with a t(4;8) involves the insertion of a super-enhancer from PCDH10 (chr4) into chr8, creating a neo-TAD containing MYC and the super-enhancer. (B) A translocation from a key MYC partner introduces a super-enhancer into the MYC TAD. (C) Deletions centromeric of MYC result in fusion of TAD containing MYC and the super-enhancer next to NSMCE2.
Figure 8.
Figure 8.
Integration of ChIP-seq for c-Myc and gene expression data identifies direct targets of MYC rearrangements. (A) 121 genes that were significantly changed in expression between samples with or without an MYC abnormality (FDR<0.05, fold-change ≥1.8) in the dataset of 526 multiple myeloma (MM) patients with RNA-sequencing. (B) All c-Myc ChIP-seq peaks detected in MM.1S and KMS11 cell lines and ordered by -log10 P-value. (C) Significant c-Myc ChIP-seq peaks (-log10 P-value >100) with highlighted PVT1 gene and genes that overlap with 121 genes (A).

References

    1. Morgan GJ, Walker BA, Davies FE. The genetic architecture of multiple myeloma. Nat Rev Cancer. 2012;12(5):335–348. - PubMed
    1. Bergsagel PL, Chesi M, Nardini E, Brents LA, Kirby SL, Kuehl WM. Promiscuous translocations into immunoglobulin heavy chain switch regions in multiple myeloma. Proc Natl Acad Sci U S A. 1996;93(24):13931–13936. - PMC - PubMed
    1. Stavnezer J, Guikema JE, Schrader CE. Mechanism and regulation of class switch recombination. Annu Rev Immunol. 2008;26:261–292. - PMC - PubMed
    1. Ramiro AR, Jankovic M, Eisenreich T, et al. AID is required for c-myc/IgH chromosome translocations in vivo. Cell. 2004;118(4):431–438. - PubMed
    1. Walker BA, Wardell CP, Brioli A, et al. Translocations at 8q24 juxtapose MYC with genes that harbor superenhancers resulting in overexpression and poor prognosis in myeloma patients. Blood Cancer J. 2014;4:e191. - PMC - PubMed

Publication types

Substances