. 2019 Jun 20;10(1):2709.
doi: 10.1038/s41467-019-10647-6.

Non-equilibrium dynamics of a nascent polypeptide during translation suppress its misfolding

Affiliations

Non-equilibrium dynamics of a nascent polypeptide during translation suppress its misfolding

Lisa M Alexander et al. Nat Commun. .

Abstract

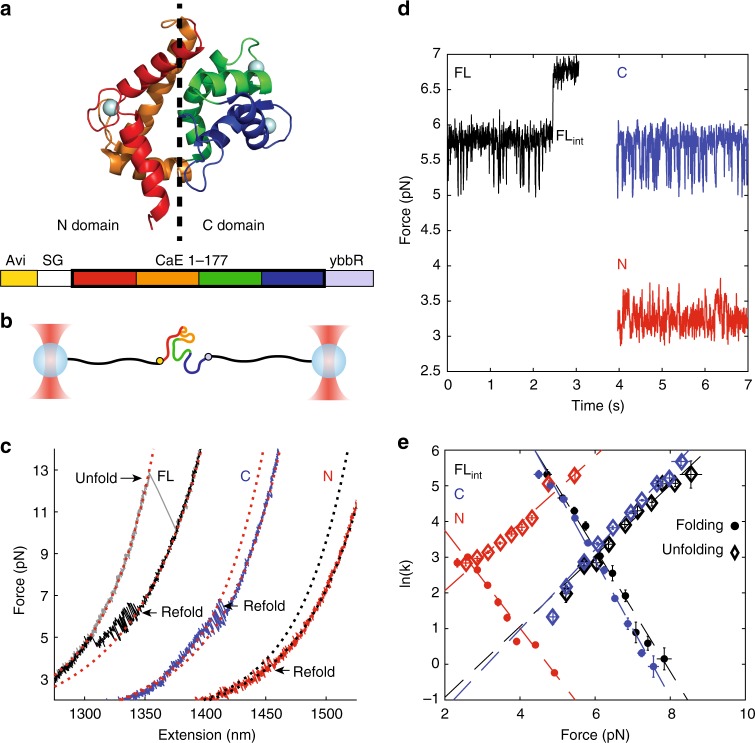
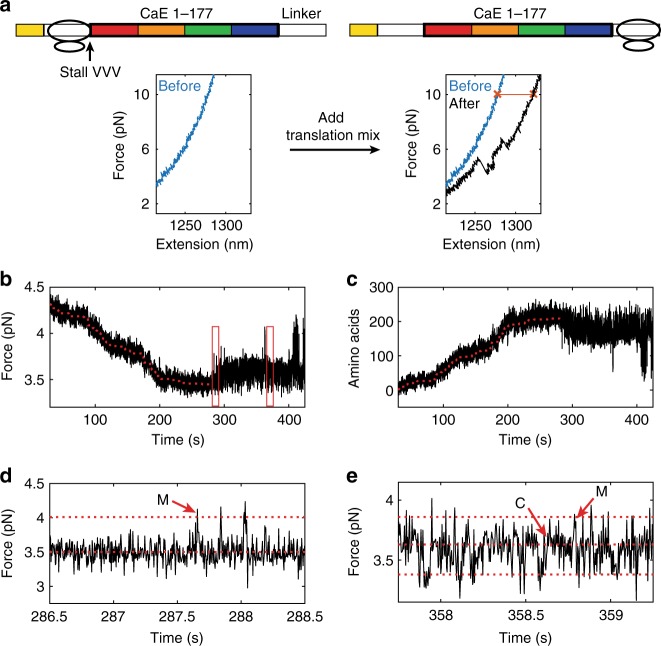
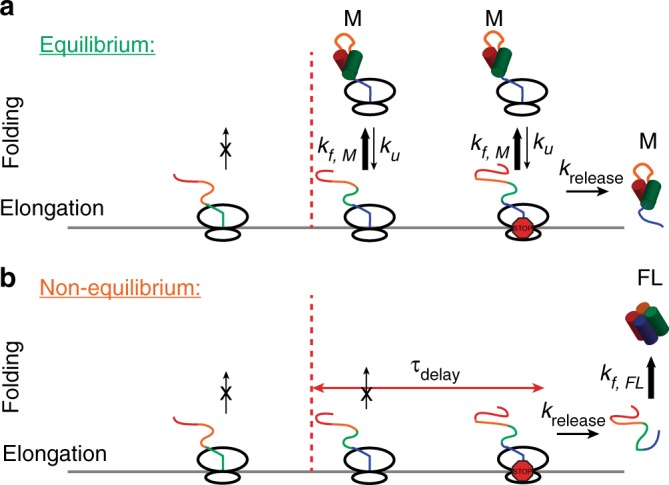
Protein folding can begin co-translationally. Due to the difference in timescale between folding and synthesis, co-translational folding is thought to occur at equilibrium for fast-folding domains. In this scenario, the folding kinetics of stalled ribosome-bound nascent chains should match the folding of nascent chains in real time. To test if this assumption is true, we compare the folding of a ribosome-bound, multi-domain calcium-binding protein stalled at different points in translation with the nascent chain as is it being synthesized in real-time, via optical tweezers. On stalled ribosomes, a misfolded state forms rapidly (1.5 s). However, during translation, this state is only attained after a long delay (63 s), indicating that, unexpectedly, the growing polypeptide is not equilibrated with its ensemble of accessible conformations. Slow equilibration on the ribosome can delay premature folding until adequate sequence is available and/or allow time for chaperone binding, thus promoting productive folding.


Conflict of interest statement

The authors declare no competing interests.

Figures

Fig. 1
Fig. 1
Full-length calerythrin folds through the C domain. a The NMR structure of calerythrin (PDB: 1NYA). EF 1, 2, 3, and 4 are red, orange, green, and blue, respectively. The protein sequence contains an Avi tag at the N terminus and ybbR tag at the C-terminus. b The geometry in OT is shown, with 2 kb of DNA on each side of the protein. c Force–extension curves of the FL, N, and C domain samples, offset in extension. The WLC model of DNA+protein is shown as dotted red lines, except for N domain, which is dotted black. The protein WLCs correspond to lengths of 177, 75, and 90 amino acids for FL, C, and N. The FL protein unfolds cooperatively (gray) and refolds in two steps (black). The C (blue) and N (red) domains fold reversibly in one step; for clarity only the refolding curves are shown. d Passive of the FL, C, and N constructs (offset in time). In all cases, the lowest observed force is the unfolded state, and then transitions are observed to a folded state. For FL (black), the first transition is FLint and the highest transition is the full-folded structure. The N and C fold to their one-domain structures. e The kinetics of folding (circles) and unfolding (diamonds) for FLint match the kinetics of the C domain but are markedly different than the N domain. Error bars are standard error (SE). FLint n = 11 molecules, 116 rate measurements; C domain n = 9 molecules, 107 rate measurements; N domain n = 13 molecules, 100 rate measurements. See Supplementary Table 1 for the fits of the Bell model (dashed lines). See Supplementary Fig. 2 for further confirmation of FLint identity. Source data are provided as a Source Data file
Fig. 2
Fig. 2
Stalled RNCs misfold. a The construct design for stalling. Using truncated mRNAs that lack a stop codon, we are able to generate homogeneously stalled ribosomes. The last codon added (in the P site) corresponds to the name of the RNC; less sequence than this will be outside the tunnel. b The OT geometry uses an N-terminal Avi tag and a tag on the ribosome itself. c Refolding force–extension curves of our RNCs do not show any folding until codon 167 or 177. WLC models are shown as dotted black or red lines. The WLC model assumed 40 amino acids in the ribosomal exit tunnel. For RNC167 and RNC177, folded WLCs show a transition of 135 amino acids. For RNC177+45, folded WLCs correspond to a transition of 75 and 177 amino acids. See Supplementary Fig. 3 for further testing. Representative force–extension curves from n = 3, 10, 9, 5, 10, 5 molecules, respectively. d An example of the folding of RNC177 and RNC177+45. RNC177 has a misfolded state larger than the C domain (75 amino acids) but smaller than the FL protein (177 amino acids). RNC177+45 folds to the FL state. The dotted lines are WLC models to 177, 135, 75, and 0 amino acids folded (black, magenta, black, black, respectively). e Passive mode data of RNC167 and RNC177 shows folding transitions to state M. HMM fit shown as dashed lines (red for RNC167 and black for RNC177). Source data are provided as a Source Data file
Fig. 3
Fig. 3
The misfolded state has altered kinetics on the ribosome. a Passive data for EF123 shows a short-lived state (N domain) in between the two more distinct states (U, unfolded, at lowest force and M, misfolded, at the highest force). The red dashed line is the HMM fit. b Overlaying the refolding curves from RNC177 (magenta) and EF123 (black) shows they are the same size transition, although EF123 has short-lived N transitions prior to full misfolding. c The folding kinetics of RNC177 are slower and the unfolding kinetics are faster relative to EF123. Diamonds: unfolding rates, circles: folding rates. Error bars are standard error (SE). See Supplementary Table 2 for the fits from the Bell plot shown. RNC177: n = 10 molecules, 111 rate measurements. EF123 (unfolding): n = 14 molecules, 97 rate measurements. EF123 (folding): n = 13 molecules, 88 rate measurements. Source data are provided as a Source Data file
Fig. 4
Fig. 4
Set-up for real-time elongation OT experiments. a The sequence for stalling and restart. RNCs were stalled at a three-valine repeat (see Supplementary Fig. 5) and restarted with the addition of translation mix in the OT (Supplementary Table 3). The force–extension curves show the lengthening of the tether after translating (red line denotes difference between blue and black force–extension curves) as well as folding of the full-length protein, which confirms the ribosome reached the end of the mRNA. b An example of ribosome translating. As each amino acid is added, the force decreases as the tether gets longer. The fit is shown as a red dotted line. c The trajectory is converted to amino acids using a worm-like-chain model. d A zoom of the panel in b that shows the folding region. The red arrows show the misfolded state and the dotted line the expected size for state M. e A zoom of the panel in b that shows the folding region later in time. At this point, both C and M are accessible (dotted lines show expected sizes, arrows mark some the transitions). Representative molecule from n = 12. Source data are provided as a Source Data file
Fig. 5
Fig. 5
Translating RNCs have a non-equilibrium delay prior to folding. a An example trajectory showing full translation of the sequence in force versus time. The blue dashed line corresponds to codon 167, when folding would begin in equilibrium conditions. τ indicates the observed delay. The inset shows a zoom to the folding region shown at higher bandwidth (267 Hz) to see the folding transitions. b Example trajectories zoomed to show just the region after passing codon 167 (blue dashed line) to the onset of folding, either the misfolded state (1st example), the C domain (2nd example), or the misfolded state with an equilibrium-like delay (3rd example). c Zoom in regions of the data in b at higher bandwidth (267 Hz) show the folding transitions. For the spike in b in the middle panel at 101.5 sec, the zoom shows that this transition is a rare event that does not correspond to N, C, or M folding as it is too small. This event does not reoccur, and was not scored as the onset of equilibrium-like folding. d The observed delay time empirical cumulative distribution function (blue dots). An exponential fit is shown as a red line, whereas the expected distribution for time until folding based on simulations using stalled RNC data is shown as a black dotted line. e Using our fit to codon position, we can also record the codon where folding first occurred (blue dots). This is compared with a simulation of equilibrium conditions (black dotted line) and a simulation assuming an additional delay step of 63 sec (red dotted line). Source data are provided as a Source Data file
Fig. 6
Fig. 6
Schematic of co-translational folding in and out of equilibrium. a The equilibrium scenario shows the onset of folding after reaching the minimum length predicted from stalled complexes (dashed red line). After this point the nascent chain misfolds. At the stop codon, the misfolded protein would be released from the ribosome. b Out of equilibrium, as we observe, there is a delay after reaching the length required to fold seen in equilibrium. This delay is long enough that the unfolded protein is released upon termination, whereupon it would fold post-translationally

References

    1. Crombie T, Swaffield JC, Brown AJP. Protein folding within the cell is influenced by controlled rates of polypeptide elongation. J. Mol. Biol. 1992;228:7–12. doi: 10.1016/0022-2836(92)90486-4. - DOI - PubMed
    1. Komar AA, Lesnik T, Reiss C. Synonymous codon substitutions affect ribosome traffic and protein folding during in vitro translation. FEBS Lett. 1999;462:387–391. doi: 10.1016/S0014-5793(99)01566-5. - DOI - PubMed
    1. Zhang G, Hubalewska M, Ignatova Z. Transient ribosomal attenuation coordinates protein synthesis and co-translational folding. Nat. Struct. Mol. Biol. 2009;16:274–280. doi: 10.1038/nsmb.1554. - DOI - PubMed
    1. Kim SJ, et al. Translational tuning optimizes nascent protein folding in cells. Science. 2015;348:444–448. doi: 10.1126/science.aaa3974. - DOI - PubMed
    1. Cabrita, L. D. et al. A structural ensemble of a ribosome-nascent chain complex during in vivo co-translational protein folding. Nat. Struct. Mol. Biol. 23, 278–285 (2016). - PMC - PubMed

Publication types